Analyzing probability of XRP breaking out of current congestion zones

Disclaimer: The findings of the following analysis are the sole opinions of the writer and should not be considered investment advice.
XRP witnessed a repeat show after the $0.86-resistance rejected its rally for the second time in three months. As a result, the buyers found it challenging to keep the price afloat above the Point of Control (POC, red).
Keeping a cynical outlook, a sustained close below the immediate support could propel the alt to test the $0.69-mark before conforming to any trend. At press time, XRP was trading at $0.7044, down by 0.85% in the last 23 hours.
XRP Daily Chart
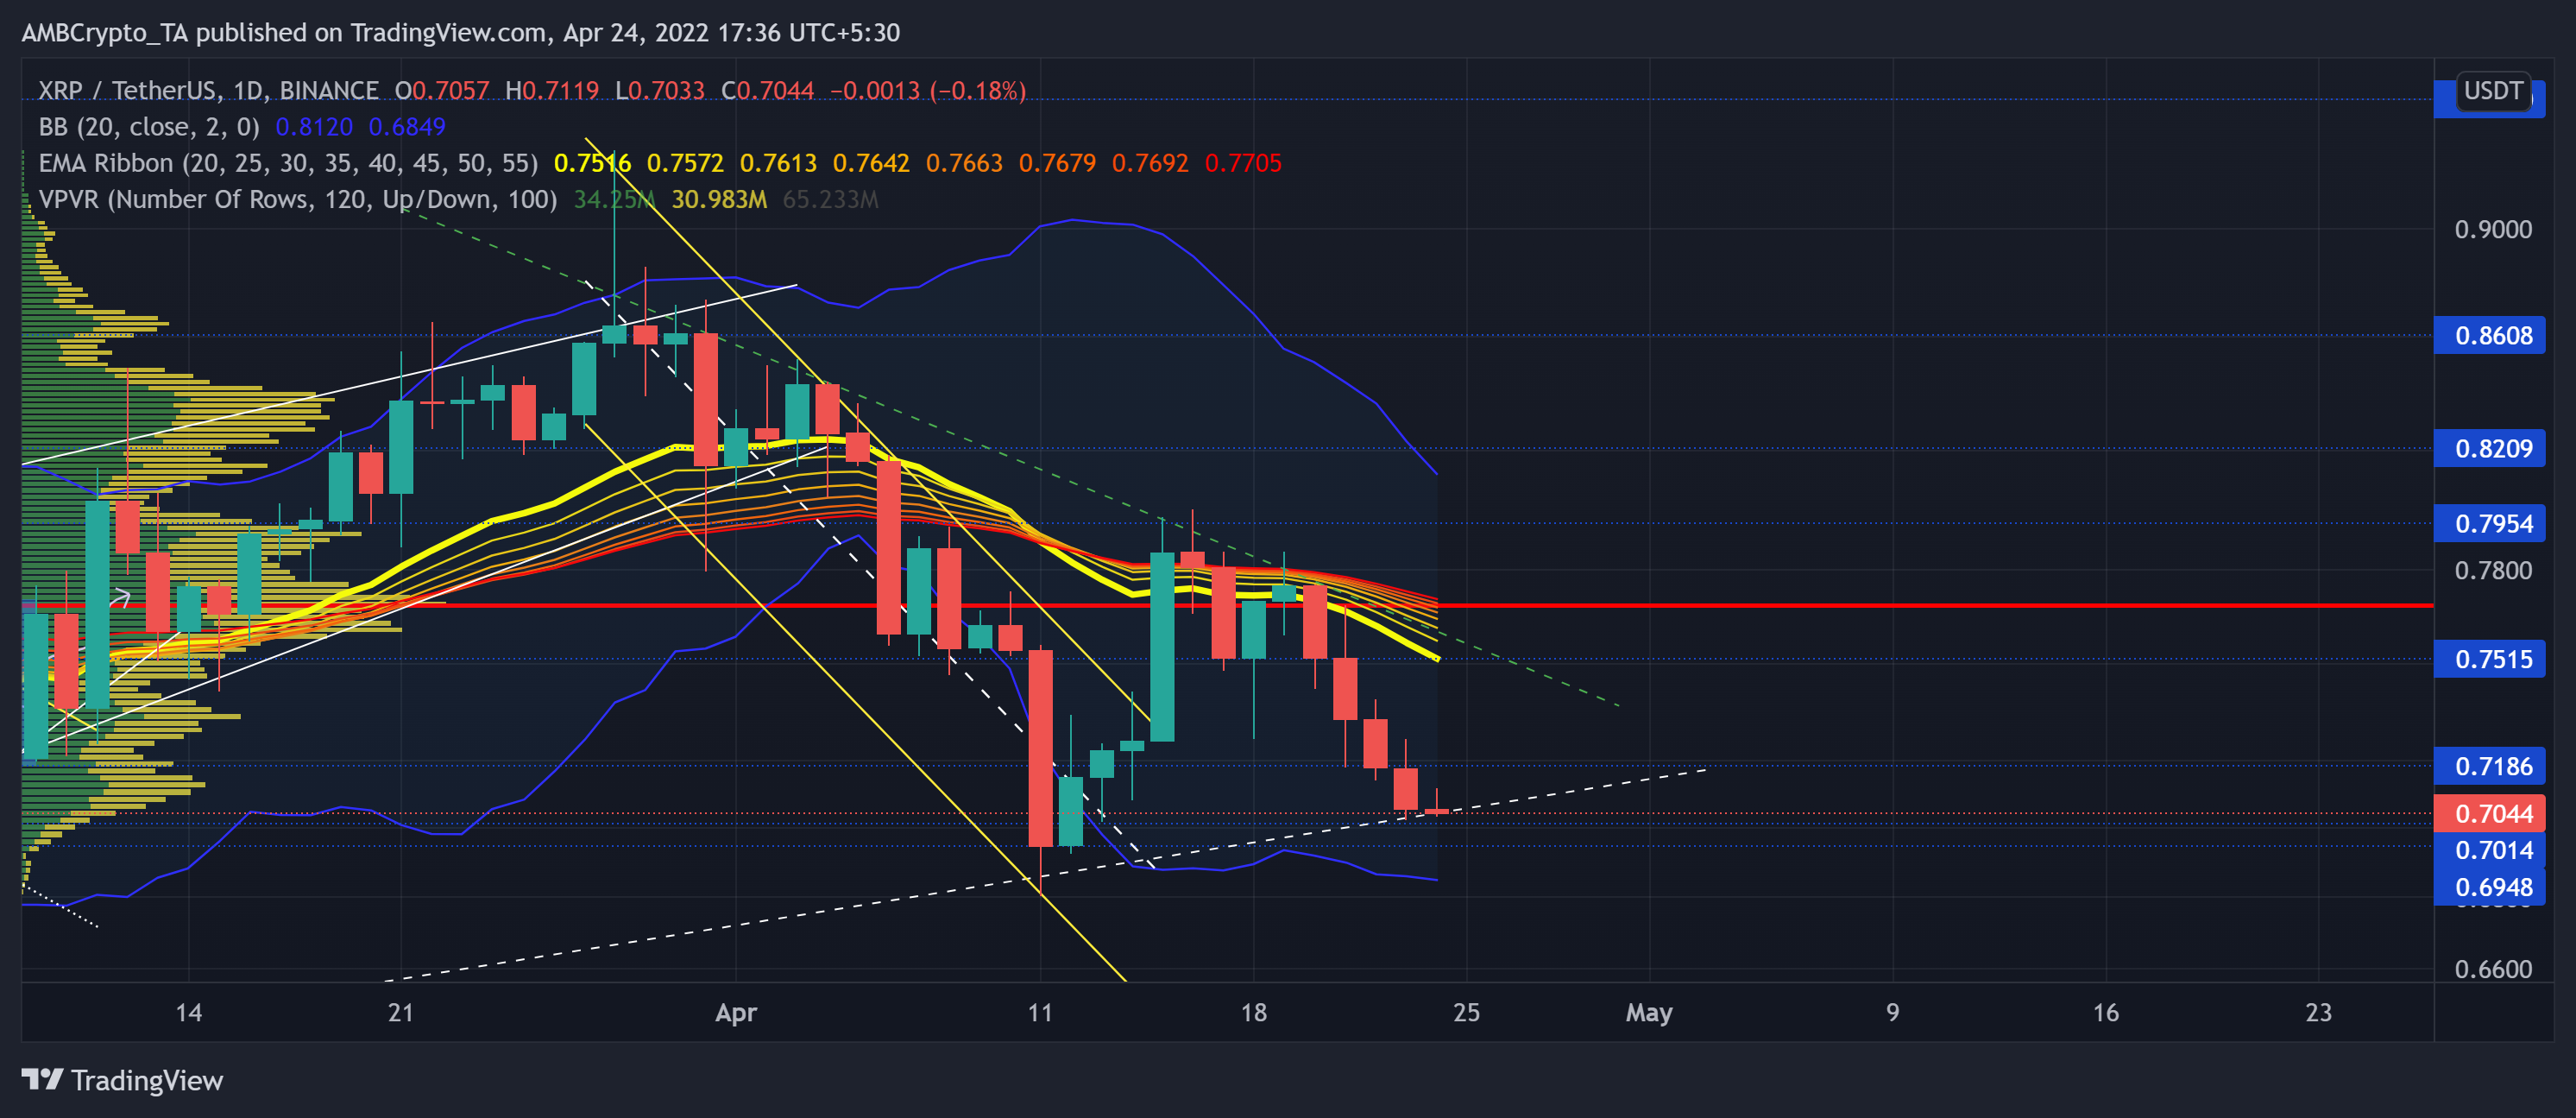
Since mid-November, the sixth largest crypto in terms of the market cap has shed nearly 47.48% of its value after slipping below some key price points.
Consequently, it hit its 11-month support at the $0.6-level on 22 January. Since then, it saw a 68.4% growth until it approached the $0.86 ceiling on 28 March. Over the last three months, the immediate trendline support (white, dashed) has offered strong support for the buyers to swoop in and stall the sell-offs.
With the EMA ribbons taking a bearish flip on the Daily timeframe, XRP’s most recent bull rally ceased at 55 EMA, near its trendline resistance (green, dashed).
Assuming the buyers re-enter at the current support level, any recovery will likely halt near its EMA ribbons at the $0.75-mark. Should the fear sentiment in the market worsen, a fall toward the lower band of the Bollinger Bands (BB) before a buying push towards the $0.75-level seemed plausible.
Rationale
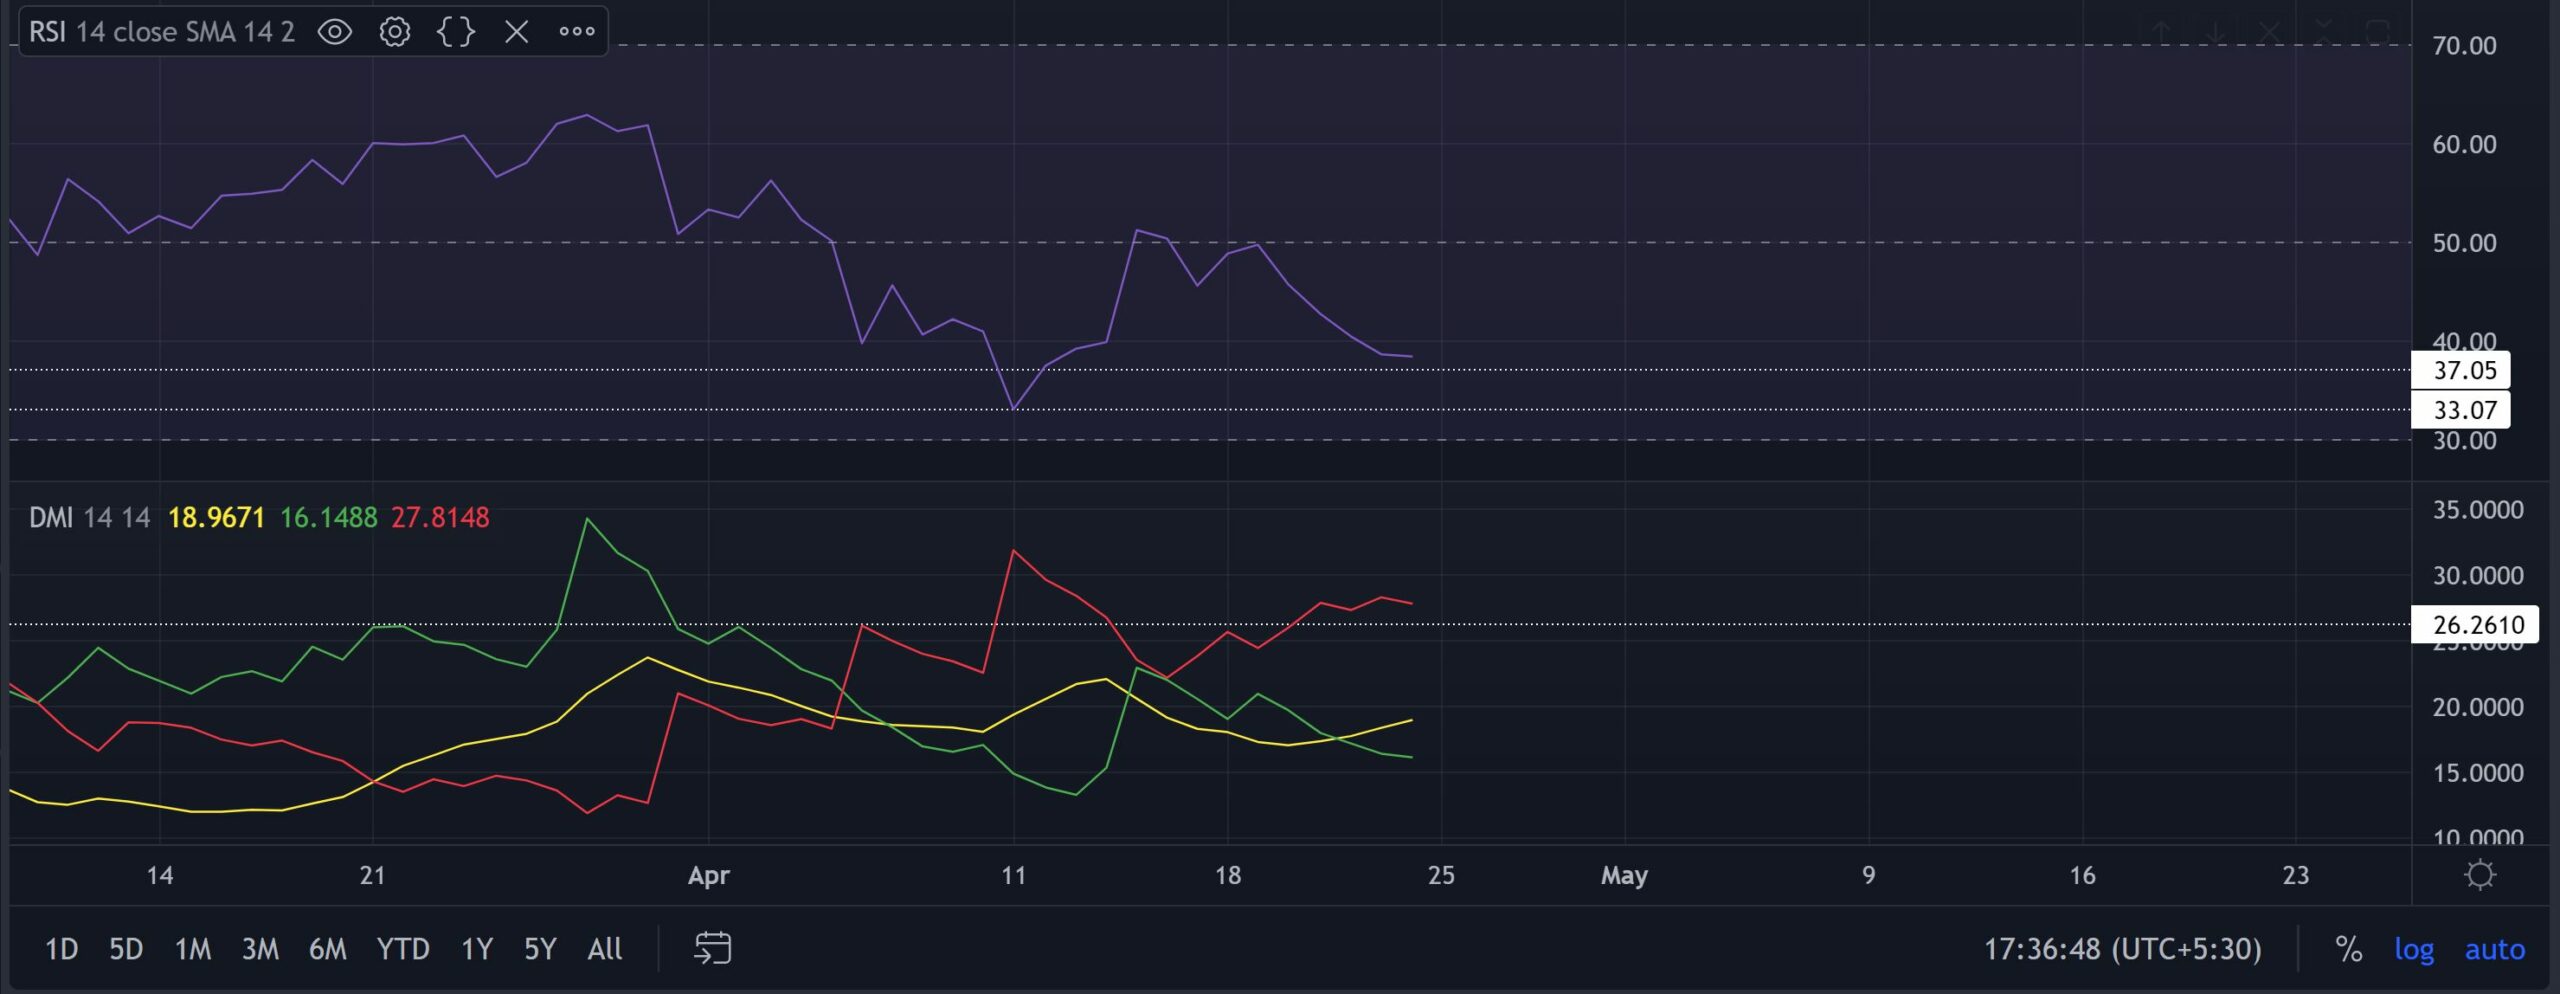
The RSI depicted weak observations after swooping from the mid-line and flattening at the 38-mark. A failure on the part of the buyers to defend the 37-mark could pave a path for an extended sluggish behavior on XRP’s chart.
Further, the DMI lines blended well with the bearish narrative while the gap between them entered the overstretched territory. But its ADX displayed a weak directional trend for the altcoin.
Conclusion
Skewing conclusions based on a conservative basis, XRP could test the lower band of the BB before a possible bull rally toward the $0.75 region. However, a sustained close below the $0.69 long-term support could lead to an extended long-term bearish stance.
Ultimately, keeping an eye on Bitcoin’s movement and the broader sentiment would be vital to complement this analysis.


