Analyzing Toncoin’s rally: Can it sustain the break above $5.47?

- Toncoin recently rebounded from a key support level near $4.6, breaking out of a descending channel.
- Derivatives data indicated strong bullish sentiment with high trading volume and open interest.
Toncoin [TON] recently experienced a strong rebound from its multi-month support near the $4.6 level. This support has been crucial for bulls over the last few months as they protected it, staving off a deeper downturn.
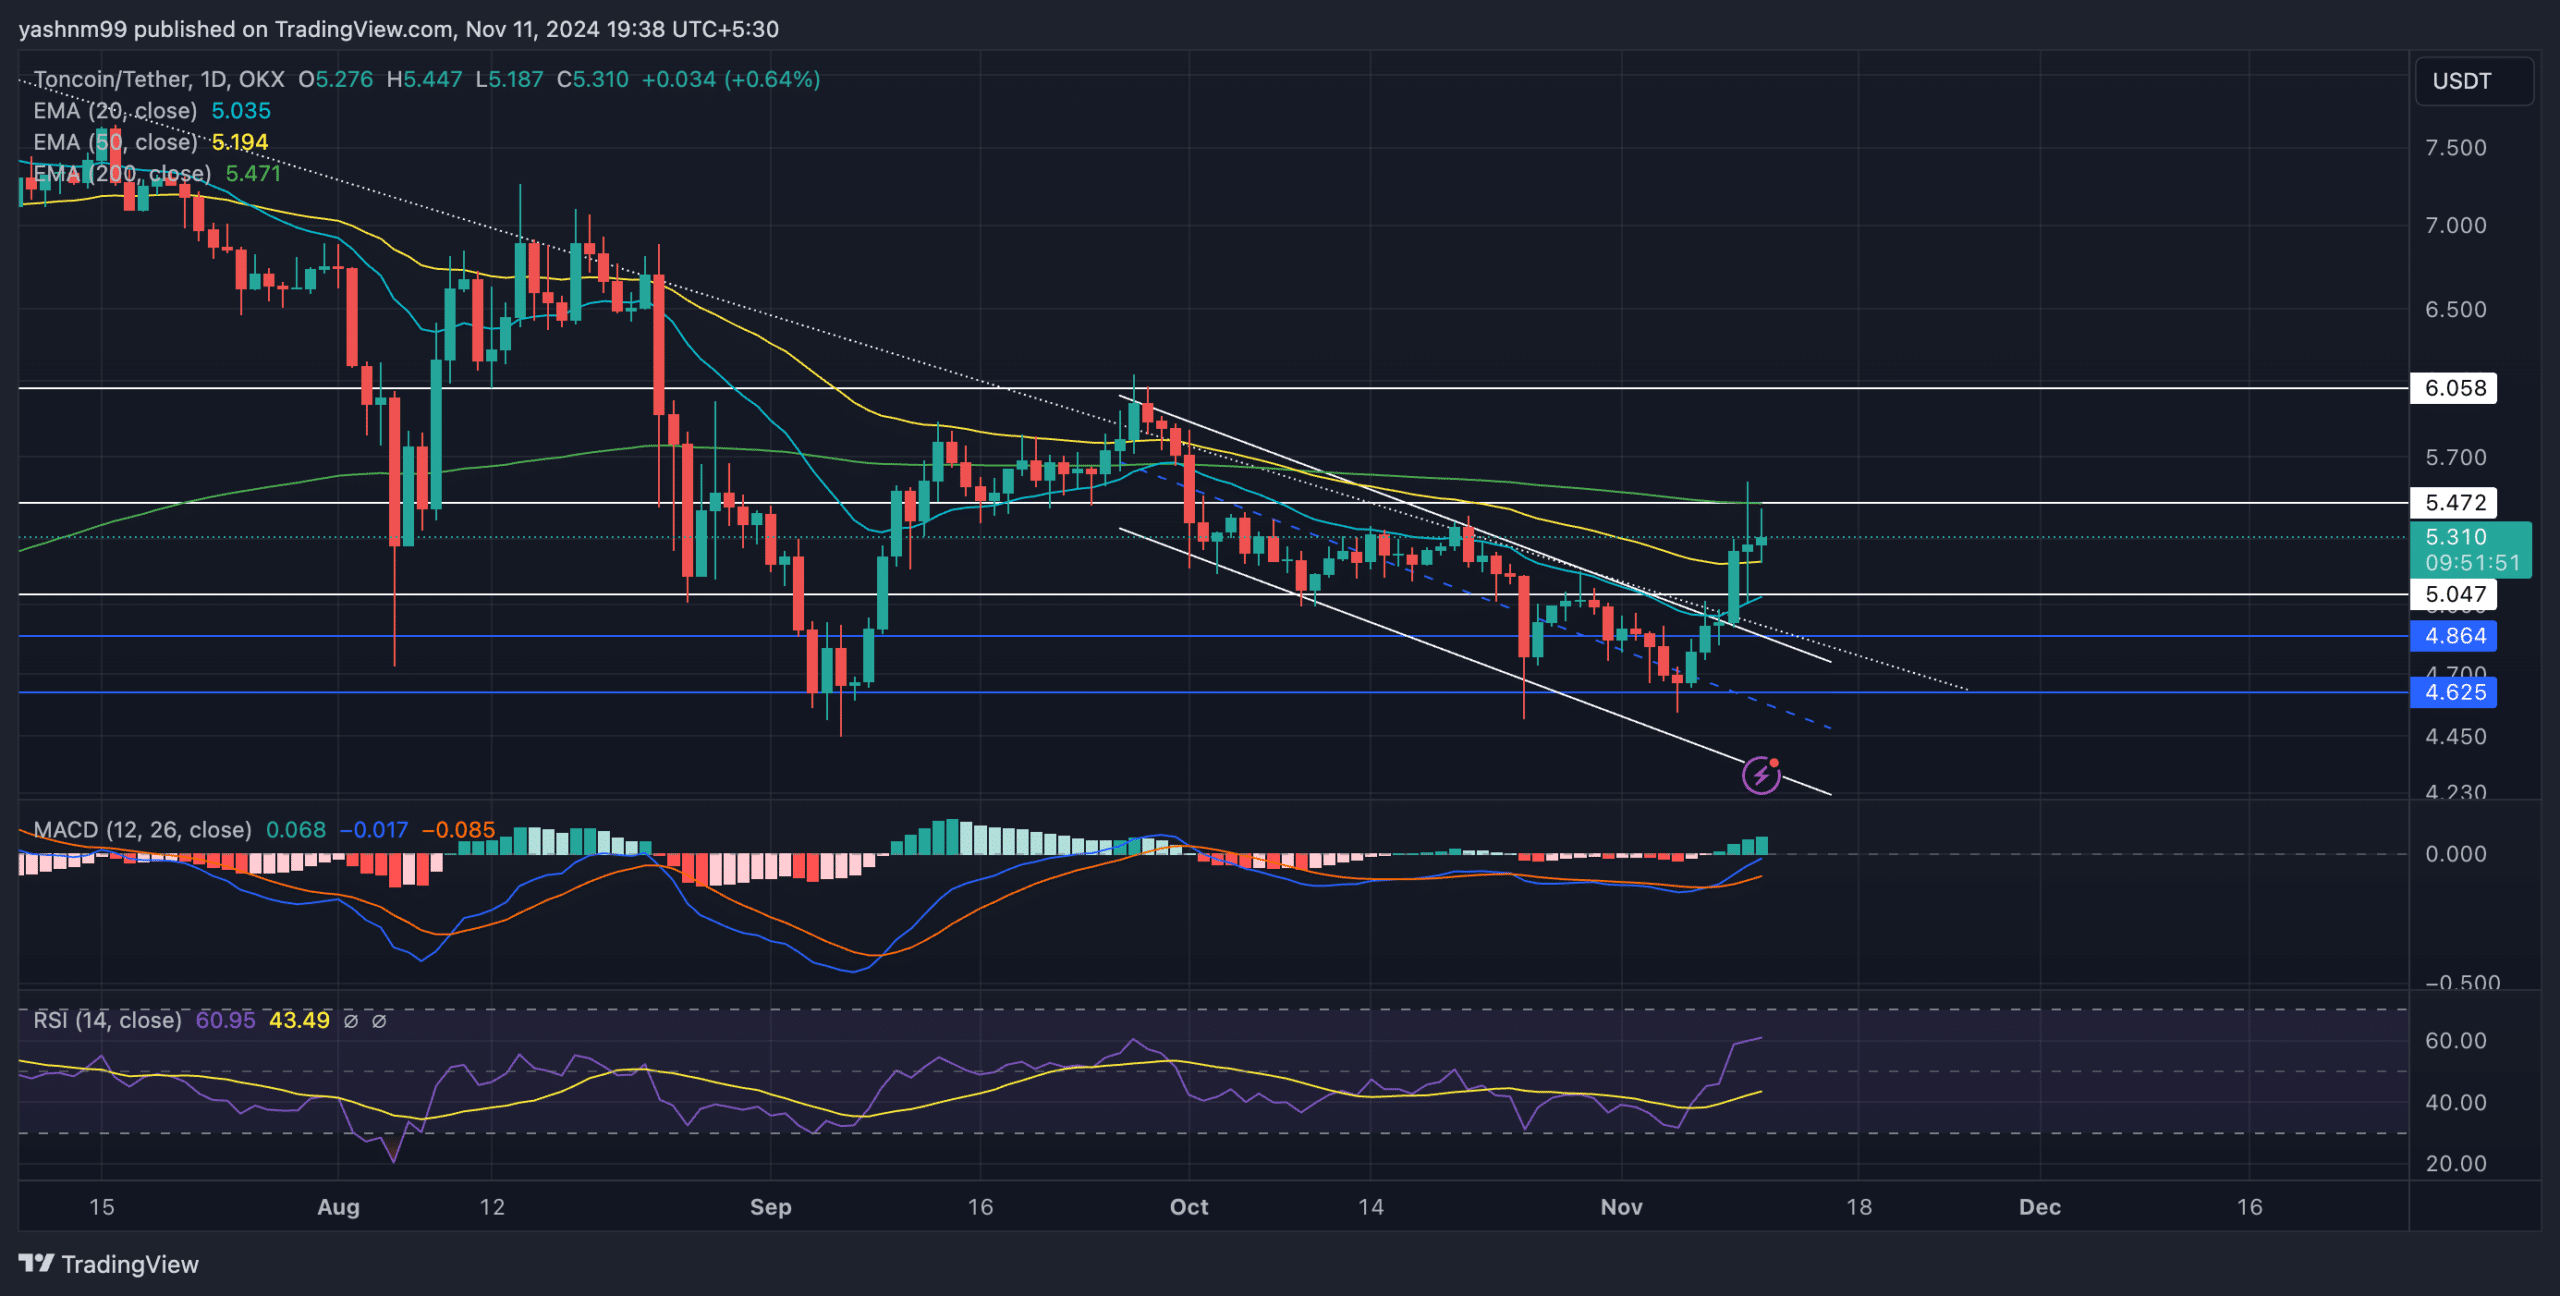
Over the last few sessions, TON broke out of a descending channel pattern, climbing past the 20-day and 50-day EMAs at $5.03 and $5.19, respectively. This movement showed an increasing buying interest in the TON market and gave bulls a slight near-term edge.
Toncoin was up 17% in the past week
At the time of writing, TON was trading at $5.28 after breaching the channel’s upper trendline. The 200-day EMA at $5.47 stood as a crucial resistance.
A definitive close above this level could further fuel the bullish rally, potentially opening doors to test the $6.05 resistance zone. If TON manages to conquer this zone, we could witness an extended uptrend with $6.5 as the next immediate target.
However, should the price struggle to break above the 200-day EMA, a pullback could be on the cards, potentially retesting the support at the 50-day EMA near $5.04. The price action would likely rebound from this level, opening up opportunities for traders to capitalize on this near-term volatility.
The MACD indicator saw a bullish crossover, with the MACD line climbing above the signal line and gaining positive momentum. However, buyers should wait for these lines to close above zero before taking a long position in the near-to-medium term.
The RSI also stood at 60, reflecting a rising bullish momentum. A move above 70 could signal overbought conditions, so traders should monitor potential consolidation around the current resistance.
Derivatives data revealed THIS
Toncoin’s derivatives data showed promising bullish sentiment as volume surged by 26.26% to reach $25.46M. Open Interest also saw an impressive jump of 22.00%, indicating that traders are holding onto their positions amid the recent bullish rally.
Interestingly, despite a rise in Open Interest, the overall long/short ratio stood at 0.6787, favoring short positions. However, this ratio on Binance and OKX for top traders was bullish, at 2.864 and 3.0486.
Is your portfolio green? Check out the Toncoin Profit Calculator
Traders should monitor TON’s movement around the $5.47 level, as a close above the 200-day EMA could confirm a bullish breakout, leading to further gains. However, any failure to break above this resistance might result in a pullback towards the $4.86-$5 zone.
Moreover, Bitcoin’s movement and the broader market sentiment should also be considered before making any buying decisions.


