ApeCoin [APE]: With recovery beyond grasp, here’s where you can find some respite

Disclaimer: The findings of the following analysis are the sole opinions of the writer and should not be considered investment advice.
The higher timeframe charts for ApeCoin suggested that the downtrend could continue, especially as a hidden bearish divergence developed. Bitcoin was also in a strong downtrend, and a move below $20k can not yet be ruled out. Fibonacci extension levels gave some support levels for APE, with the $3 also likely to be important in the days and weeks to come.
APE- 12-Hour Chart
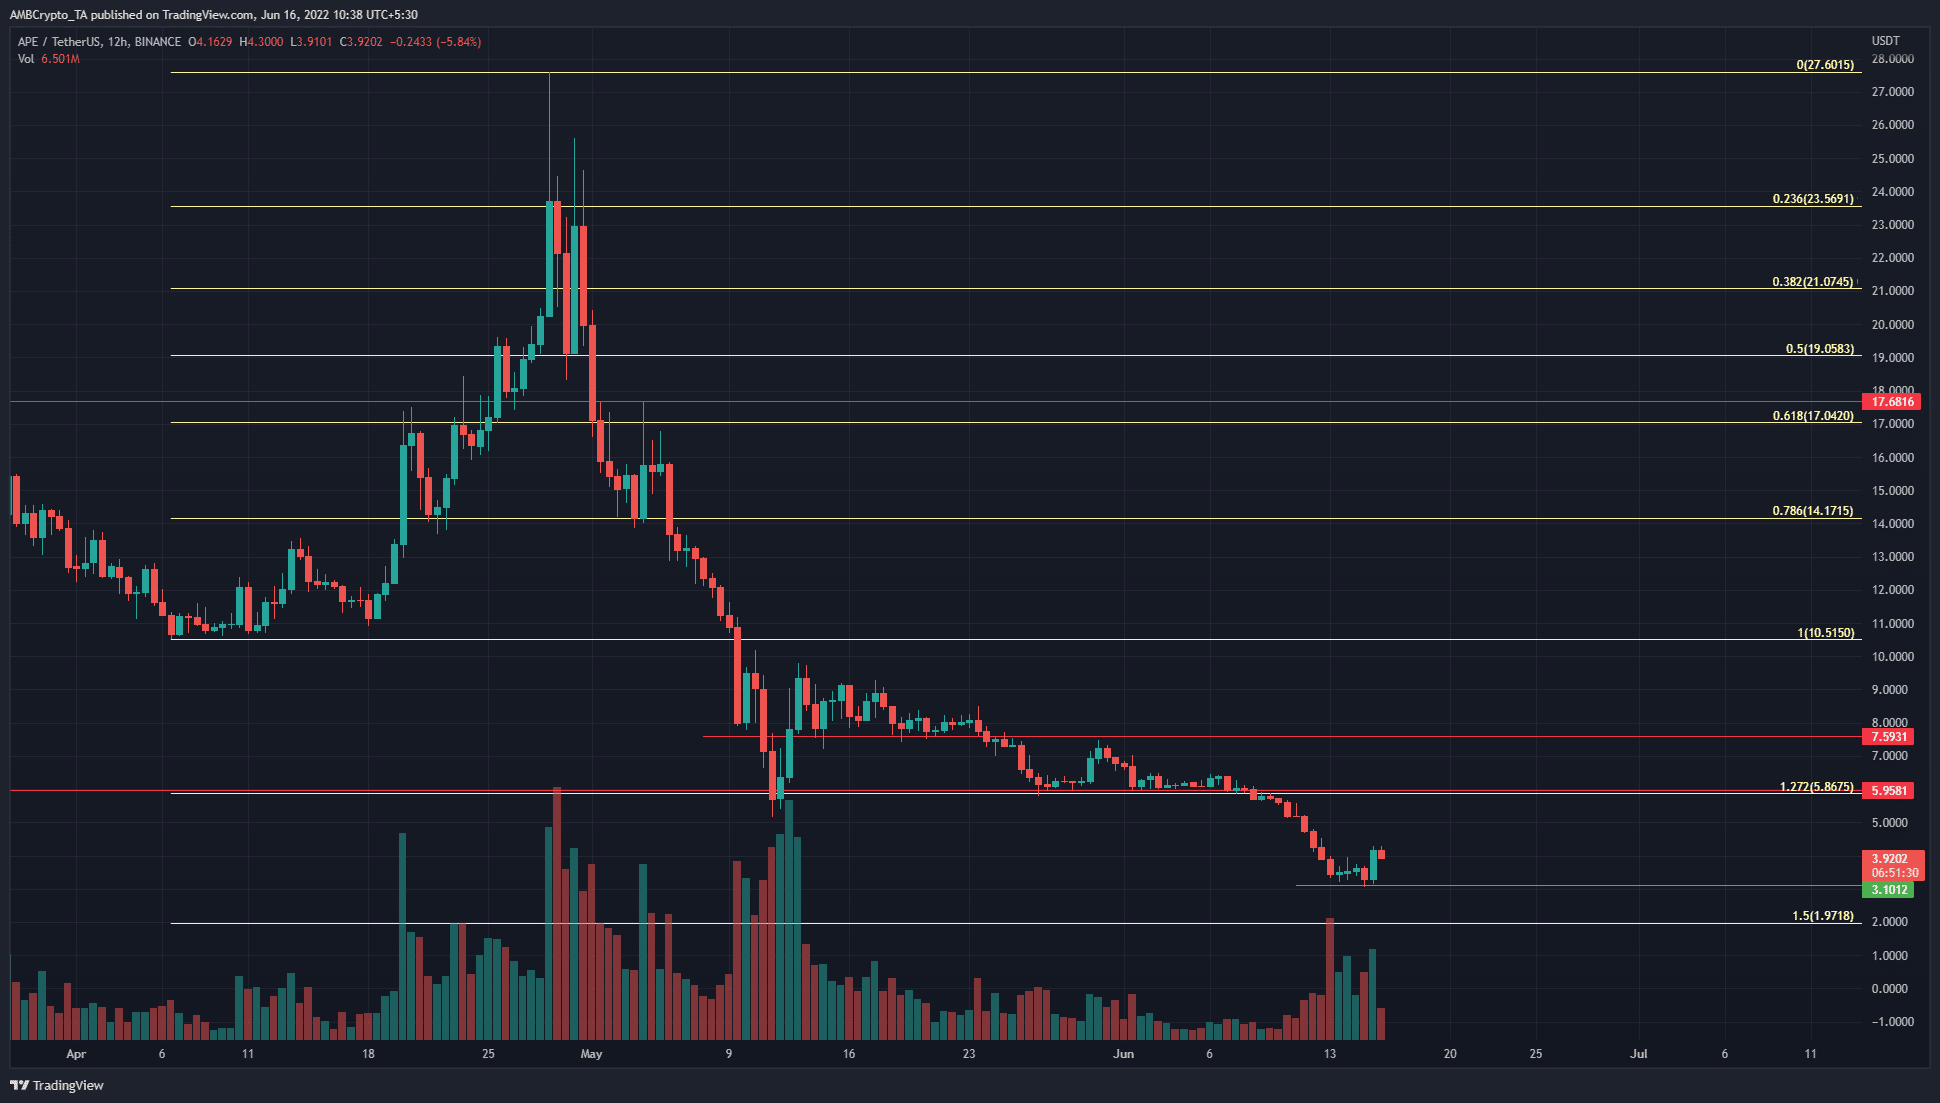
The Fibonacci retracement and extension levels (pale yellow) were plotted for a move up from $10.51 to $27.6. This APE move occurred back in April. The extension levels to the downside gave support levels at $5.86 and $1.97.
The $5.86-$6 area also had a long-term horizontal support level which has since been flipped to resistance. The selling pressure of June saw APE slide right past the $5 and $4 psychological support levels. $3.1 came to the rescue, and a bullish engulfing candle was seen in the most recent trading session.
Does this indicate a rally upward? Not necessarily. On the higher timeframes, even a move to $5 would be insufficient to flip the market structure to bullish.
Rationale
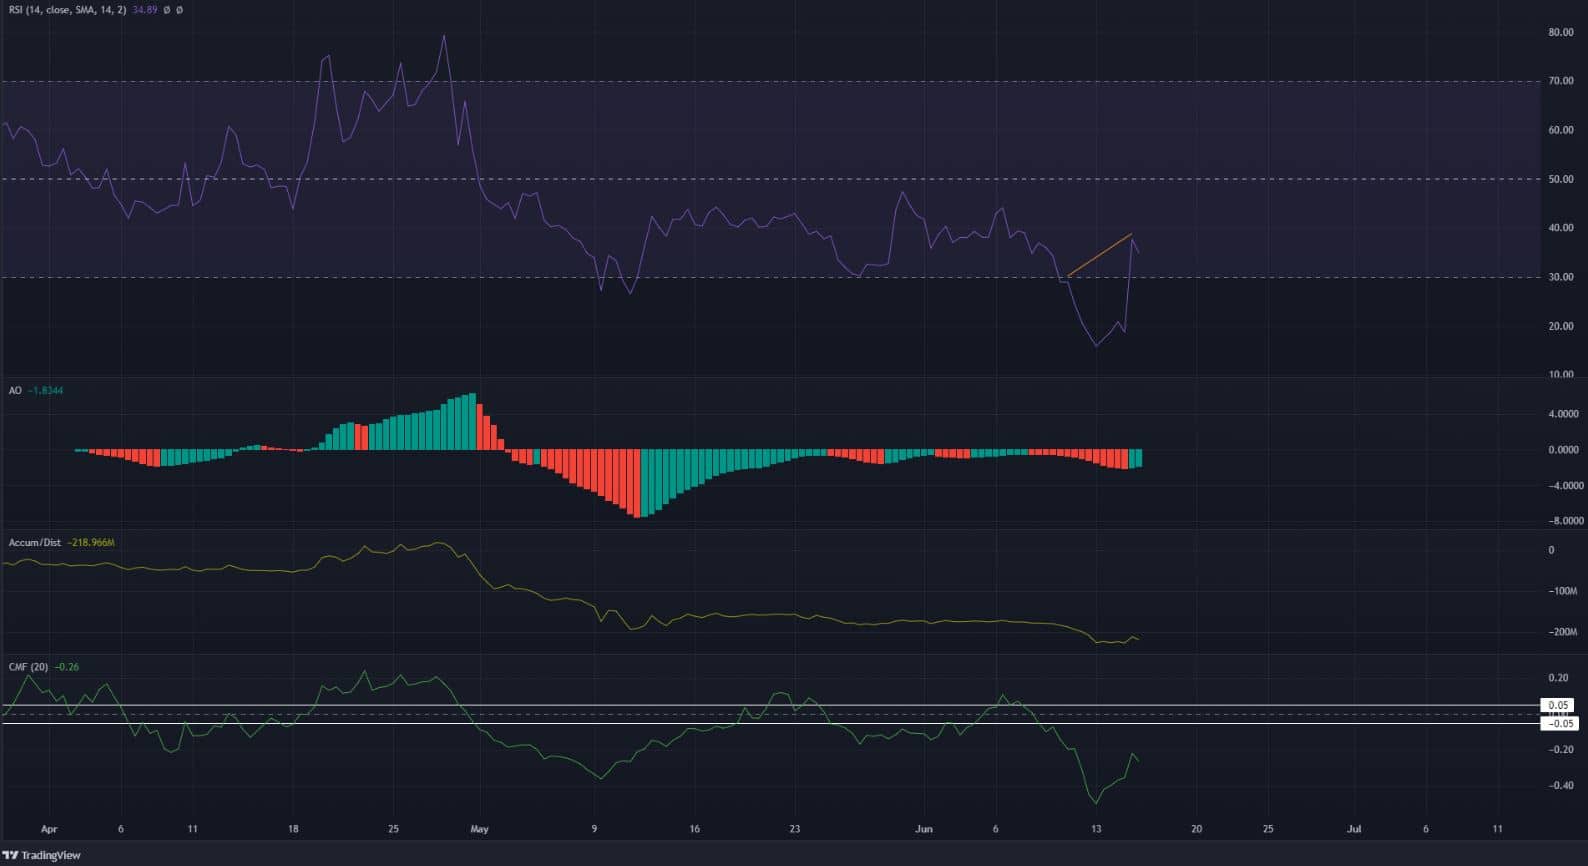
The RSI has been below the neutral 50 line since late April. This signifies the brute strength of the bears in recent weeks. At the time of writing, a hidden bearish divergence (orange) materialized. The price made a lower high while the RSI climbed higher. The divergence indicated a continuation in the previous downtrend.
The Awesome Oscillator was also below the zero line, to show momentum was southward. The A/D line also descended down the charts. Combined with a CMF value of -0.26, the selling pressure was shown to be acute.
Conclusion
The severe sell-side pressure meant that recovery was unlikely for ApeCoin just yet. A move above $7.5 would be needed to break the bearish market structure. At press time, the demand to initiate such a recovery was not yet seen.


