ApeCoin, Cardano, MATIC Price Analysis: 25 March

The altcoin market was bullish on lower timeframes, as Bitcoin and Ethereum led the crypto rally. Demand drove the rallies, and bullish market structures seem to be established for many altcoins on lower timeframes. Apecoin was an exception and was unable to push past previous highs and appeared to establish a range. Cardano and MATIC looked ready to make further gains.
ApeCoin (APE)
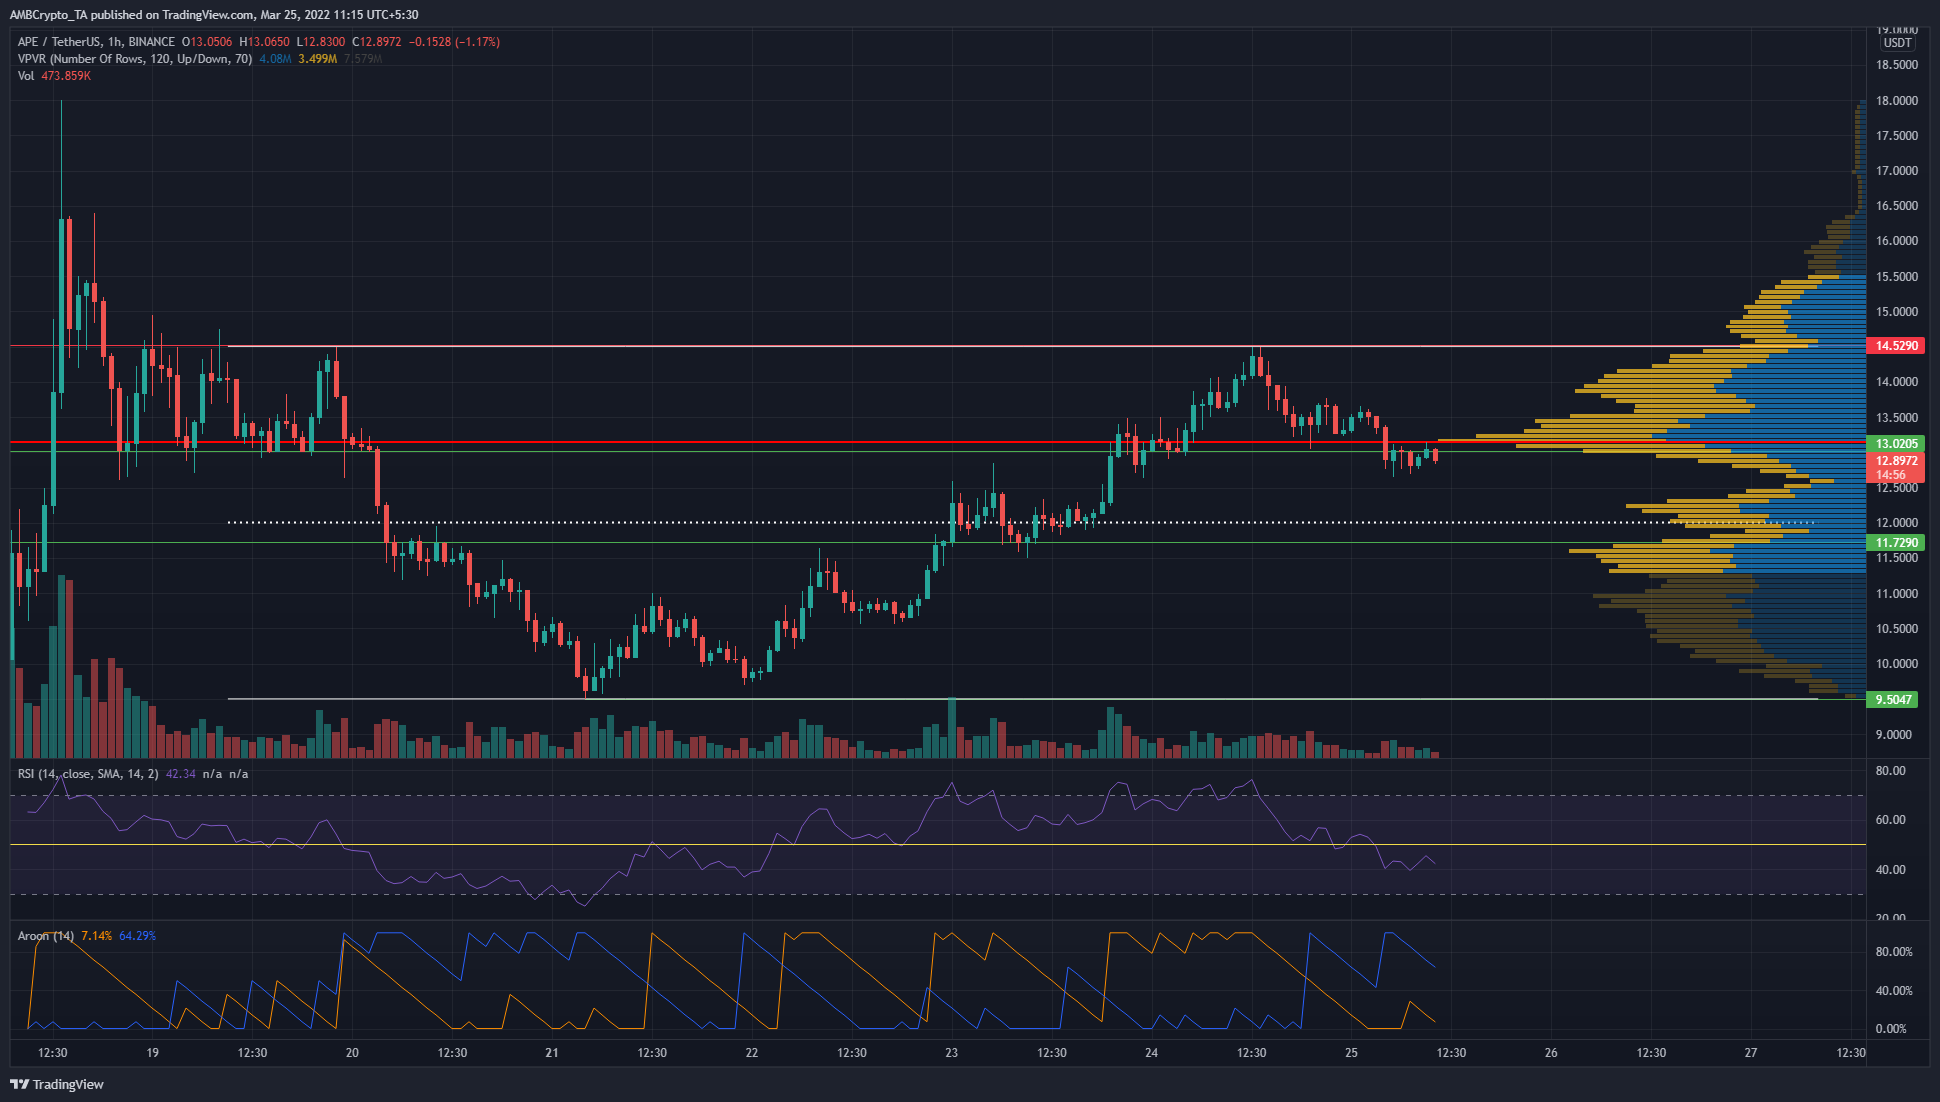
ApeCoin had been strongly bullish on the charts as it approached the $14.5 resistance level. A breakout past this level would have been encouraging for the bulls. However, a rejection was seen and the price appeared to have slipped beneath the $13 support level as well and flipped it to resistance. The price had also fallen beneath the Volume Profile Visible Range’s Point of Control at $13.17.
In the short term, a further slide to the $11.8-$12 region was likely for APE. The RSI had slipped below neutral 50 to indicate that short-term bearishness could be seen. The Aroon indicator also noted a move southward was in progress, with the Aroon Down (blue) reaching high on the charts.
Cardano (ADA)
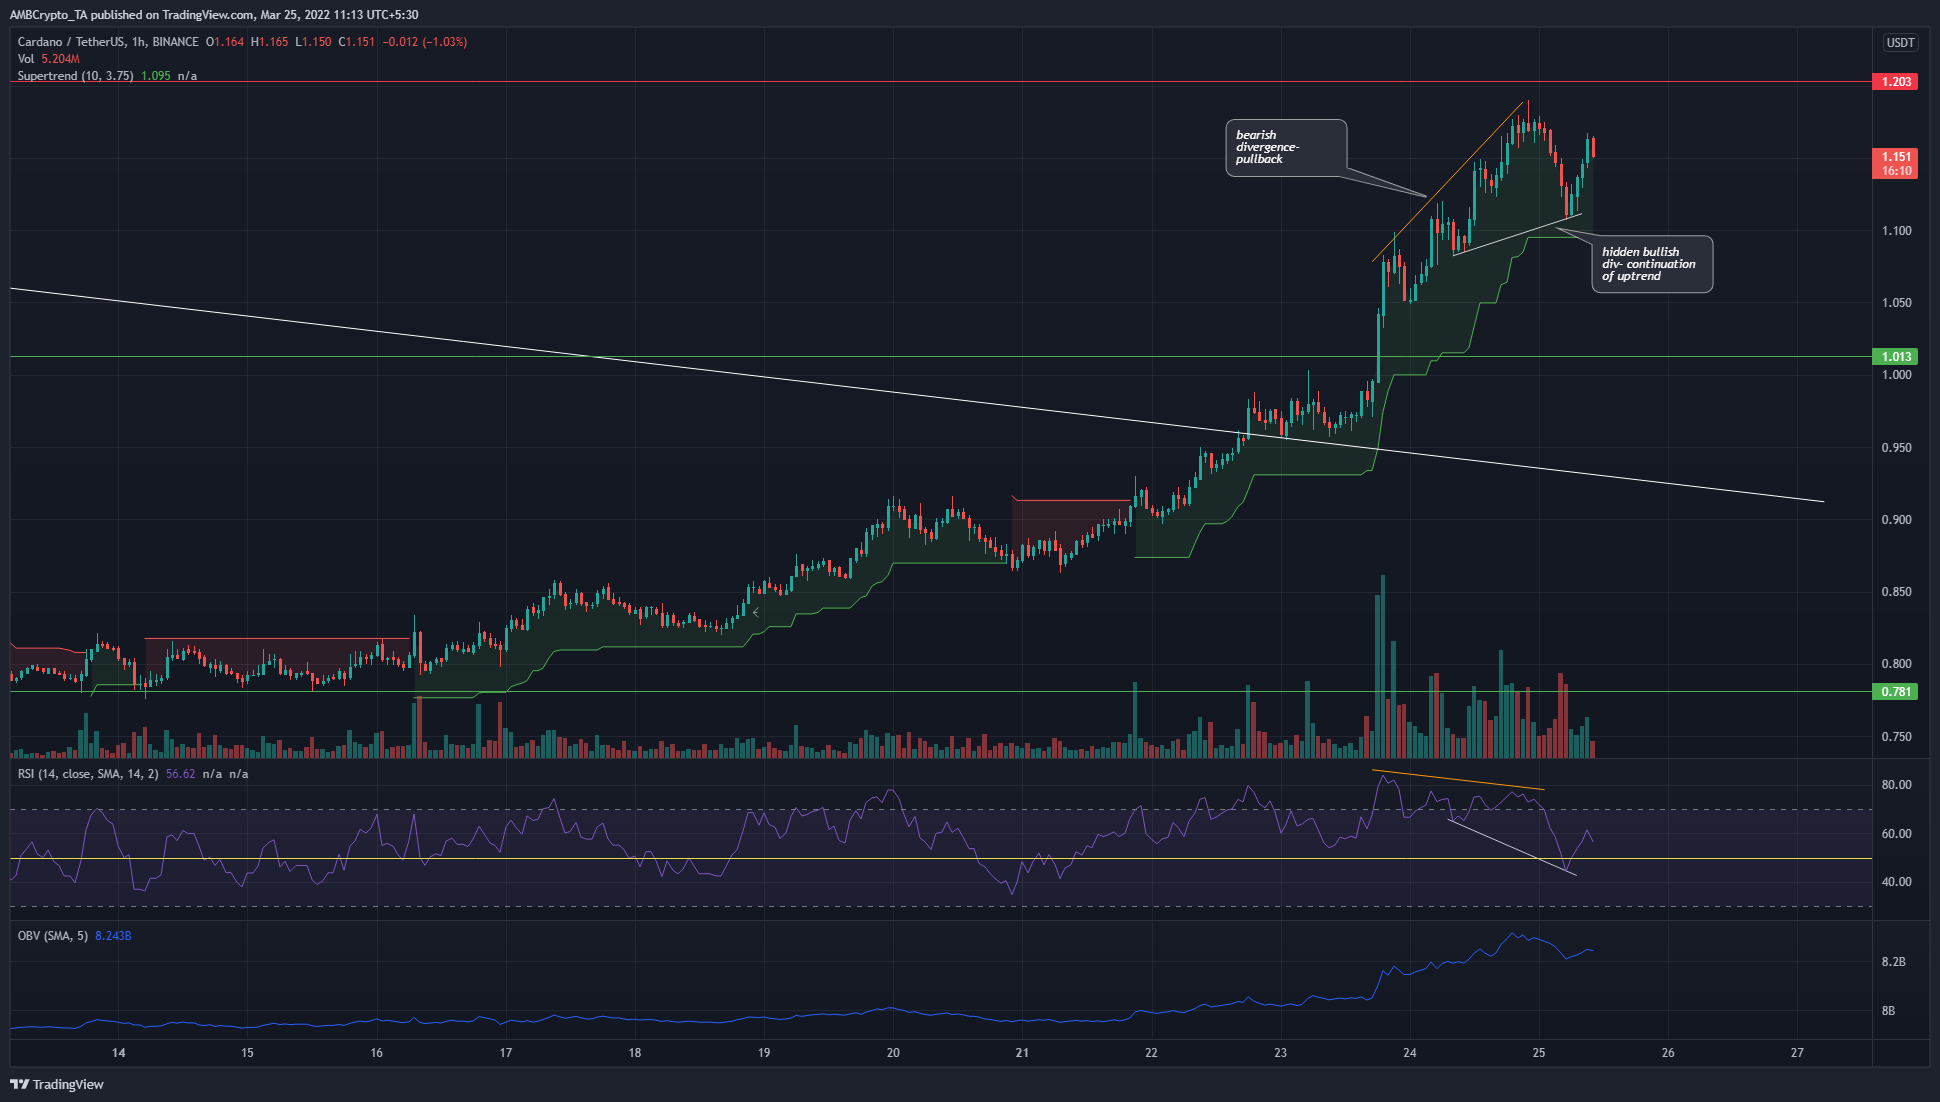
Cardano broke out past a long-term falling wedge and, in the past couple of days, also climbed past the $1 level. This level was an important technical and psychological resistance level.
On the hourly timeframe, ADA showed a bearish divergence (orange) which saw the coin pull back from $1.17 to $1.1. This was followed by a hidden bullish divergence (white). Generally, this signals that the resumption of the previous uptrend was likely. The OBV has been climbing, while the Supertrend indicator also showed a buy signal.
Polygon (MATIC)
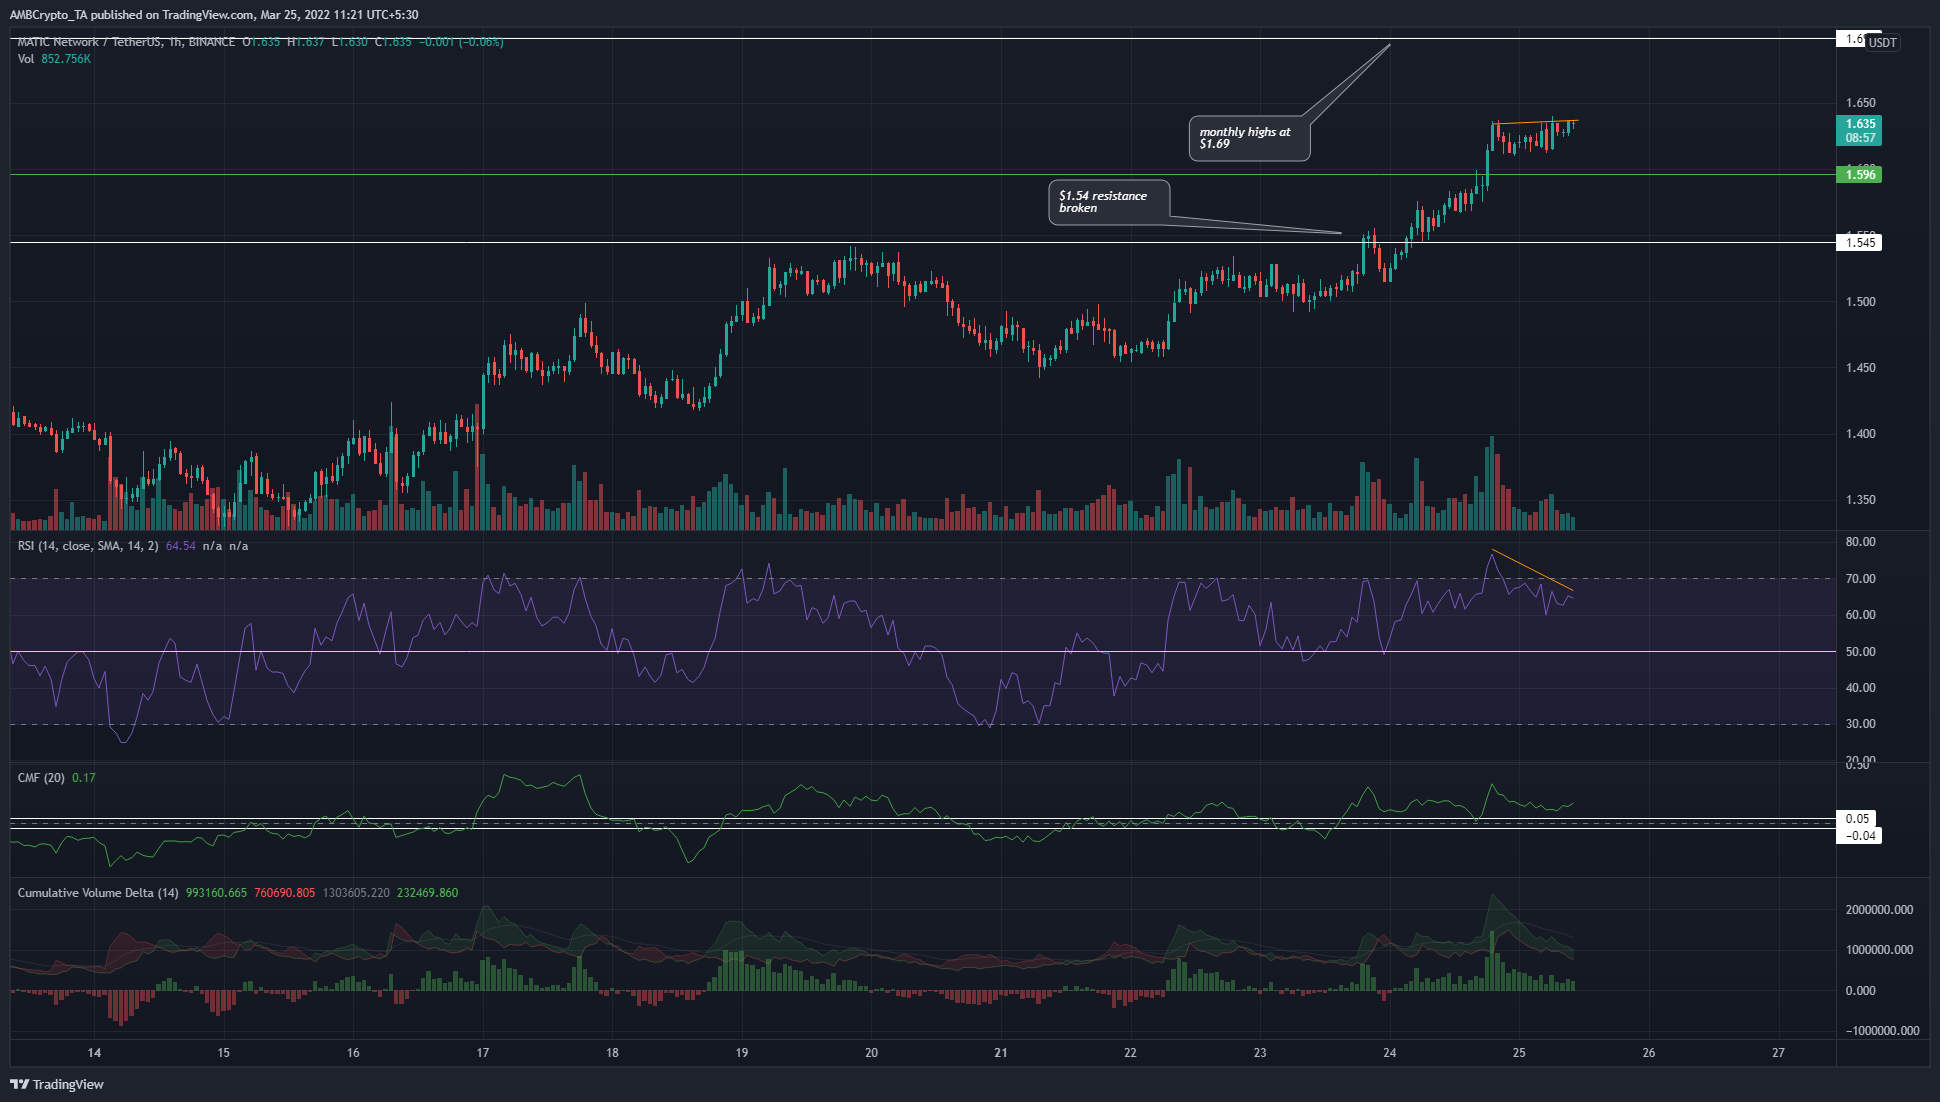
MATIC also showed a bearish divergence, as the price pushed higher while the RSI dipped. However, MATIC was above the $1.54 level and had a bullish market structure. The $1.63 area and the $1.69 level, represent the monthly high.
The Chaikin Money Flow and the Cumulative Volume Delta were green, both of which showed that demand was present.