APT is declining, but here’s why activity on the network is not slowing down

- Aptos has seen increased user activity in the past few days.
- APT’s price is set to decline further with a drop in token accumulation.
Following a prolonged rally in price, the fall in buying pressure has led to a decline in Aptos’s [APT] price in the last week. However, according to data from Artemis, amid a decline in APT’s value, the past few days have been marked by increased user activity for the layer 1 (L1) proof-of-stake (PoS) blockchain.
Aptos is up 3.8x YTD
Core Fundamentals are spiking in the last day
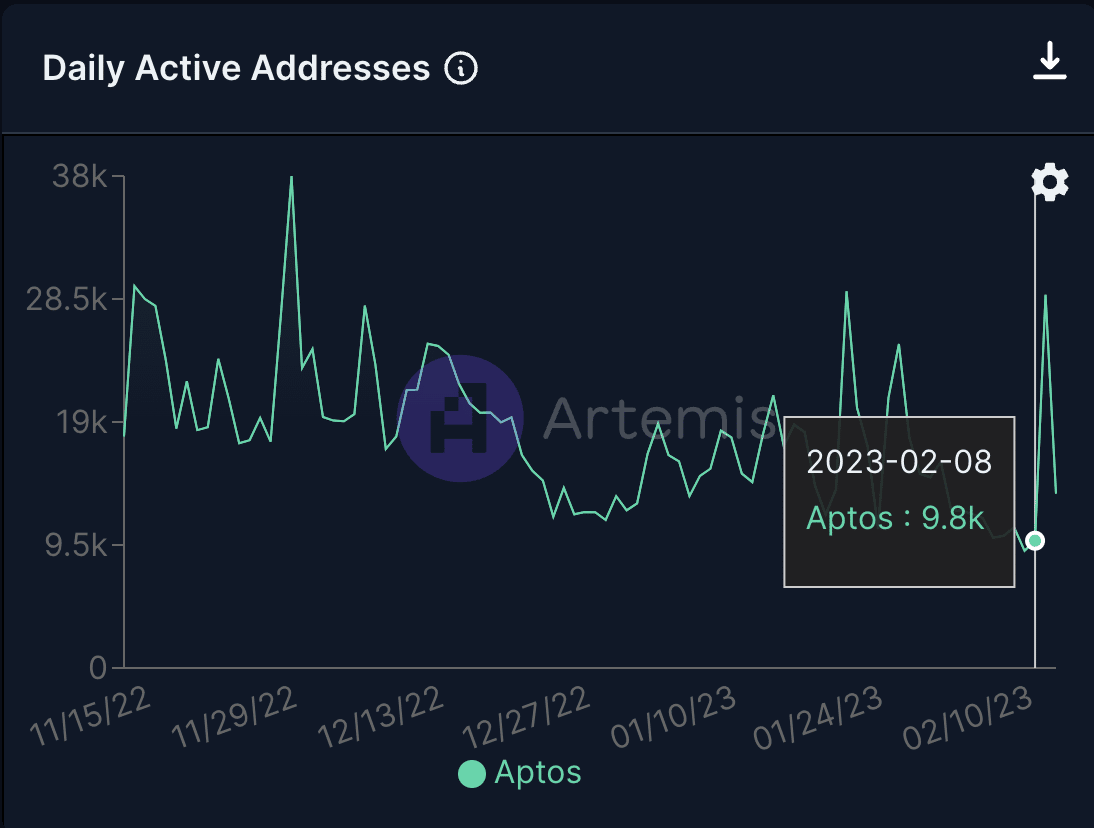
– Daily Active Addresses 28.8k up 3x
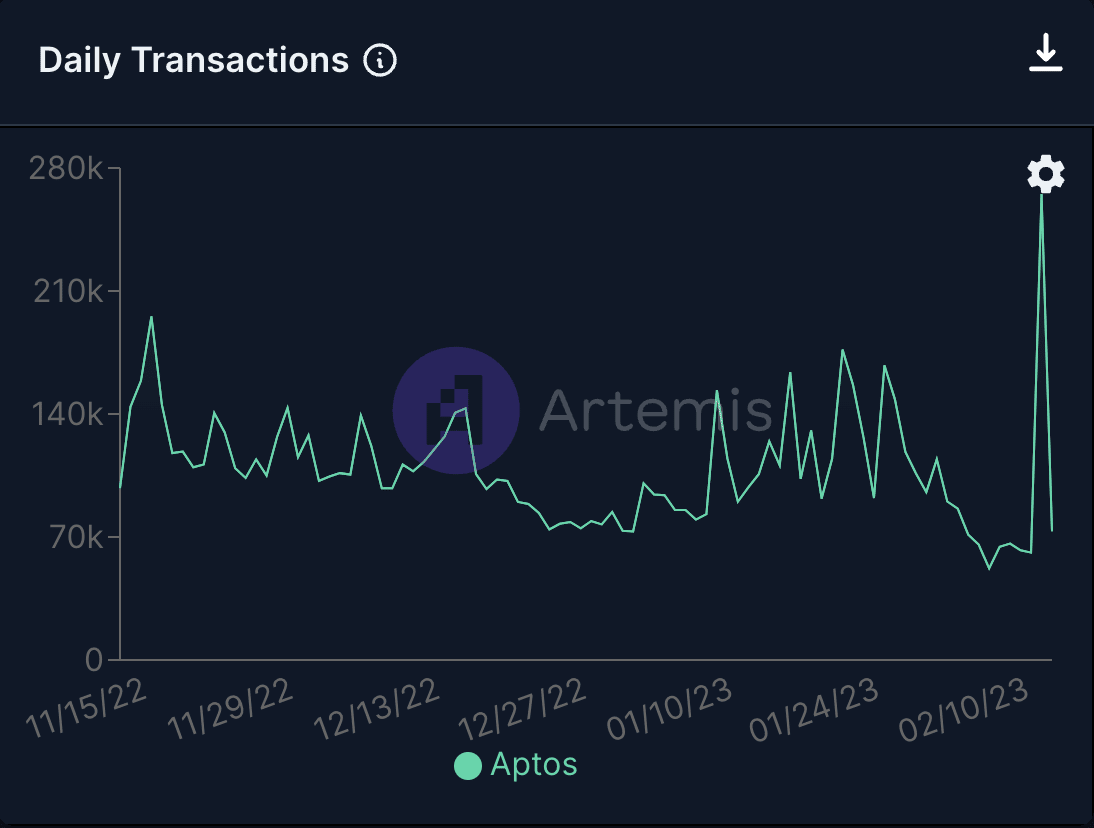
– Daily Transactions at 265k up 4xWhat's driving growth? pic.twitter.com/aaTQBZzdq4
— Artemis (@artemis) February 10, 2023
Is your portfolio green? Check out the Aptos Profit Calculator
Per data from the cryptocurrency metrics aggregator, the count of daily active addresses on the network embarked on a rally on 7 February to peak at 28,800 active addresses on 9 February. As of this writing, active addresses on the network totaled 13,500.
Further, the daily transactions count on the network clinched an all-time high of 265,100 on 9 February. Since then, this has decreased by 72%. As of 10 February, the count of transactions completed on the network totaled 73,200.
According to Artemis, the surge in user activity was attributable to “a significant amount of activity on NFTs, DEXs, and wallets” on the Aptos blockchain.
We found https://t.co/3HoPHffn4r to be useful to dig into Aptos related apps but site seems to be temporarily down.
Screenshot from the apstats last week showed a significant amount of activity is on NFTs, DEXs and wallets.
300+ projects and roughly 1-2 projects started daily. pic.twitter.com/aaV9SOMBkA
— Artemis (@artemis) February 10, 2023
Read Aptos’ [APT] Price Prediction 2023-2024
APT is for sale, but few are interested
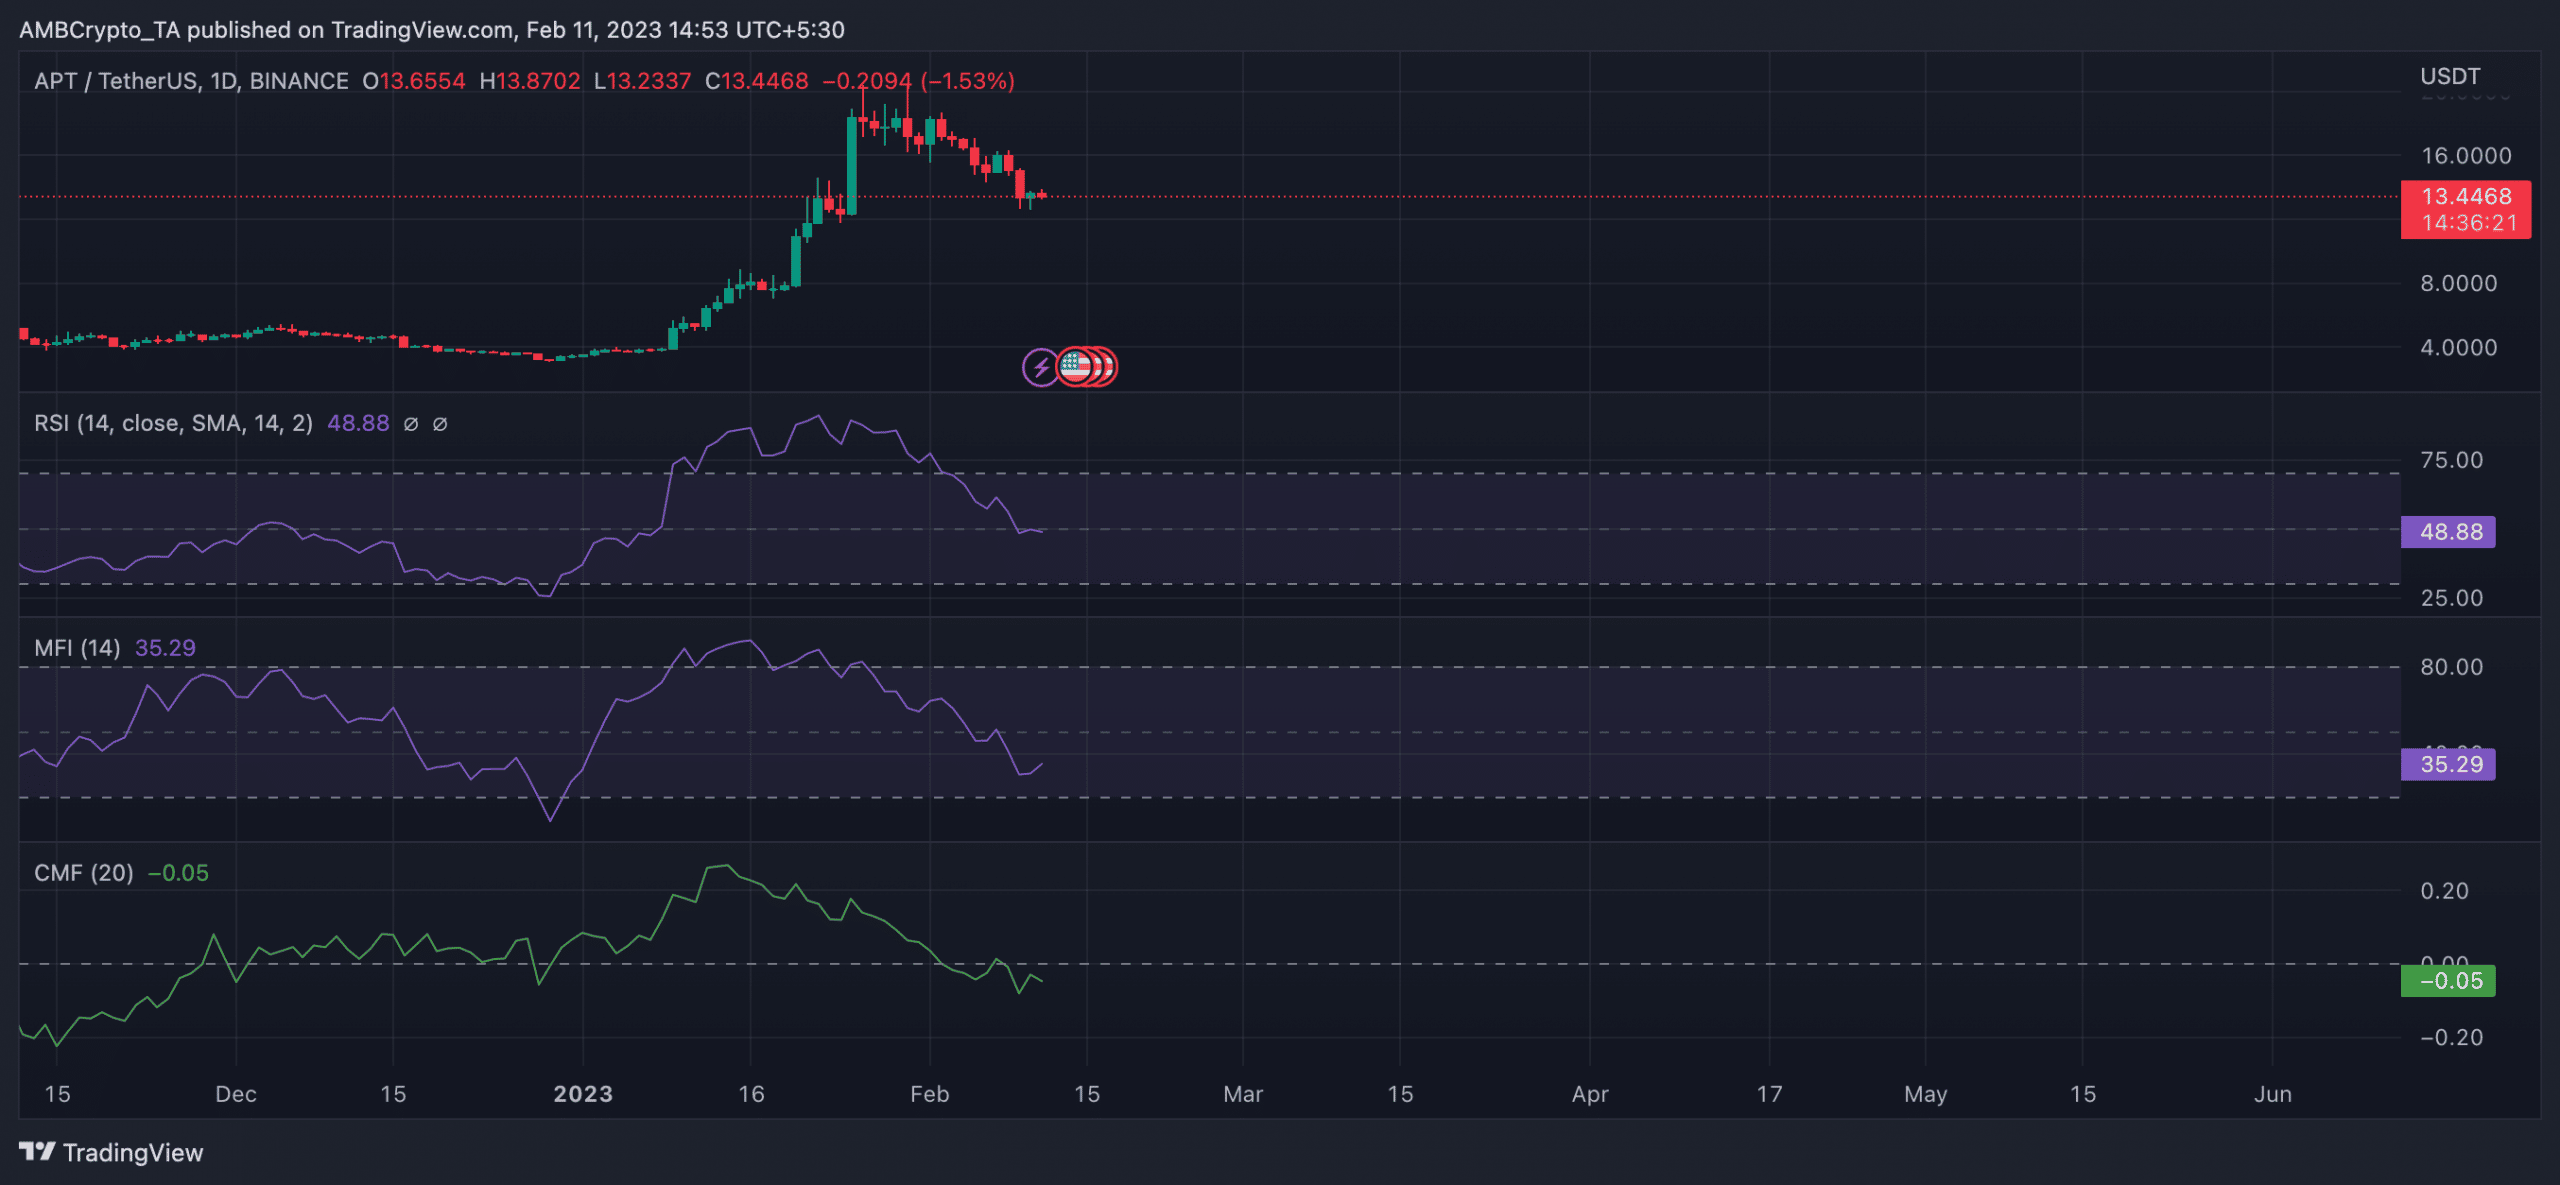
At press time, APT traded at $13.49. After the alt’s price peaked at $19.86 on 26 January, it has since declined by 32%.
The steep decline in APT’s price in the last two weeks is attributable to the waning buying pressure. An assessment of the token’s price movement on the price chart revealed this.
Key momentum indicators that previously laid at overbought highs were spotted close to the oversold regions at the time of writing. APT’s Relative Strength Index (RSI) was below its neutral spot at 48.88, while its Money Flow Index (MFI) was pegged at 35.29.
These showed that buying momentum has dropped significantly in the past few weeks, as many traders proceeded to cash out their profits on their initial investments.
With the Chaikin Money Flow (CMF) below the center line at -0.05, APT’s price was bound to decline even further. A negative CMF value indicates that there is more selling pressure than buying pressure. Therefore, as long as the CMF remains in decline, it is reasonable to expect that APT’s price may continue to drop.