Aptos [APT]: At overbought highs, here’s how profit-taking might affect you
![Aptos [APT]: At overbought highs, here's how profit-taking might affect you](https://ambcrypto.com/wp-content/uploads/2023/01/1672640574819-25c9a67e-05fb-4887-ad59-5a4a8da3ccaf-1.jpg)
- APT’s price went up by over 90% in the last week.
- The altcoin was severely overbought at press time, and a price correction might be imminent.
Aptos [APT] rallied by 92% in the last week, making it the crypto asset with the most gains in the last seven days, data from CoinMarketCap showed. During the intraday trading session on 21 January, APT’s value rose by 56% to trade above $12. This represented a four-fold increase from its lowest price of $3 in December 2022.
How much are 1,10,100 APTs worth today?
With a 10% jump in price in the last 24 hours, APT ranked as the asset with the most gains during that period.
While APT had been on an upward trend since the beginning of the year, the astronomical surge in value in the last 48 hours was attributable to the launch of two new APT liquidity pools on Binance Liquid Swap on 20 January.
Leading cryptocurrency exchange Binance, via a blog post published on 20 January, announced the launch of four new liquidity pools consisting of APT/BTC, APT/USDT, HFT/BTC, and HFT/USDT.
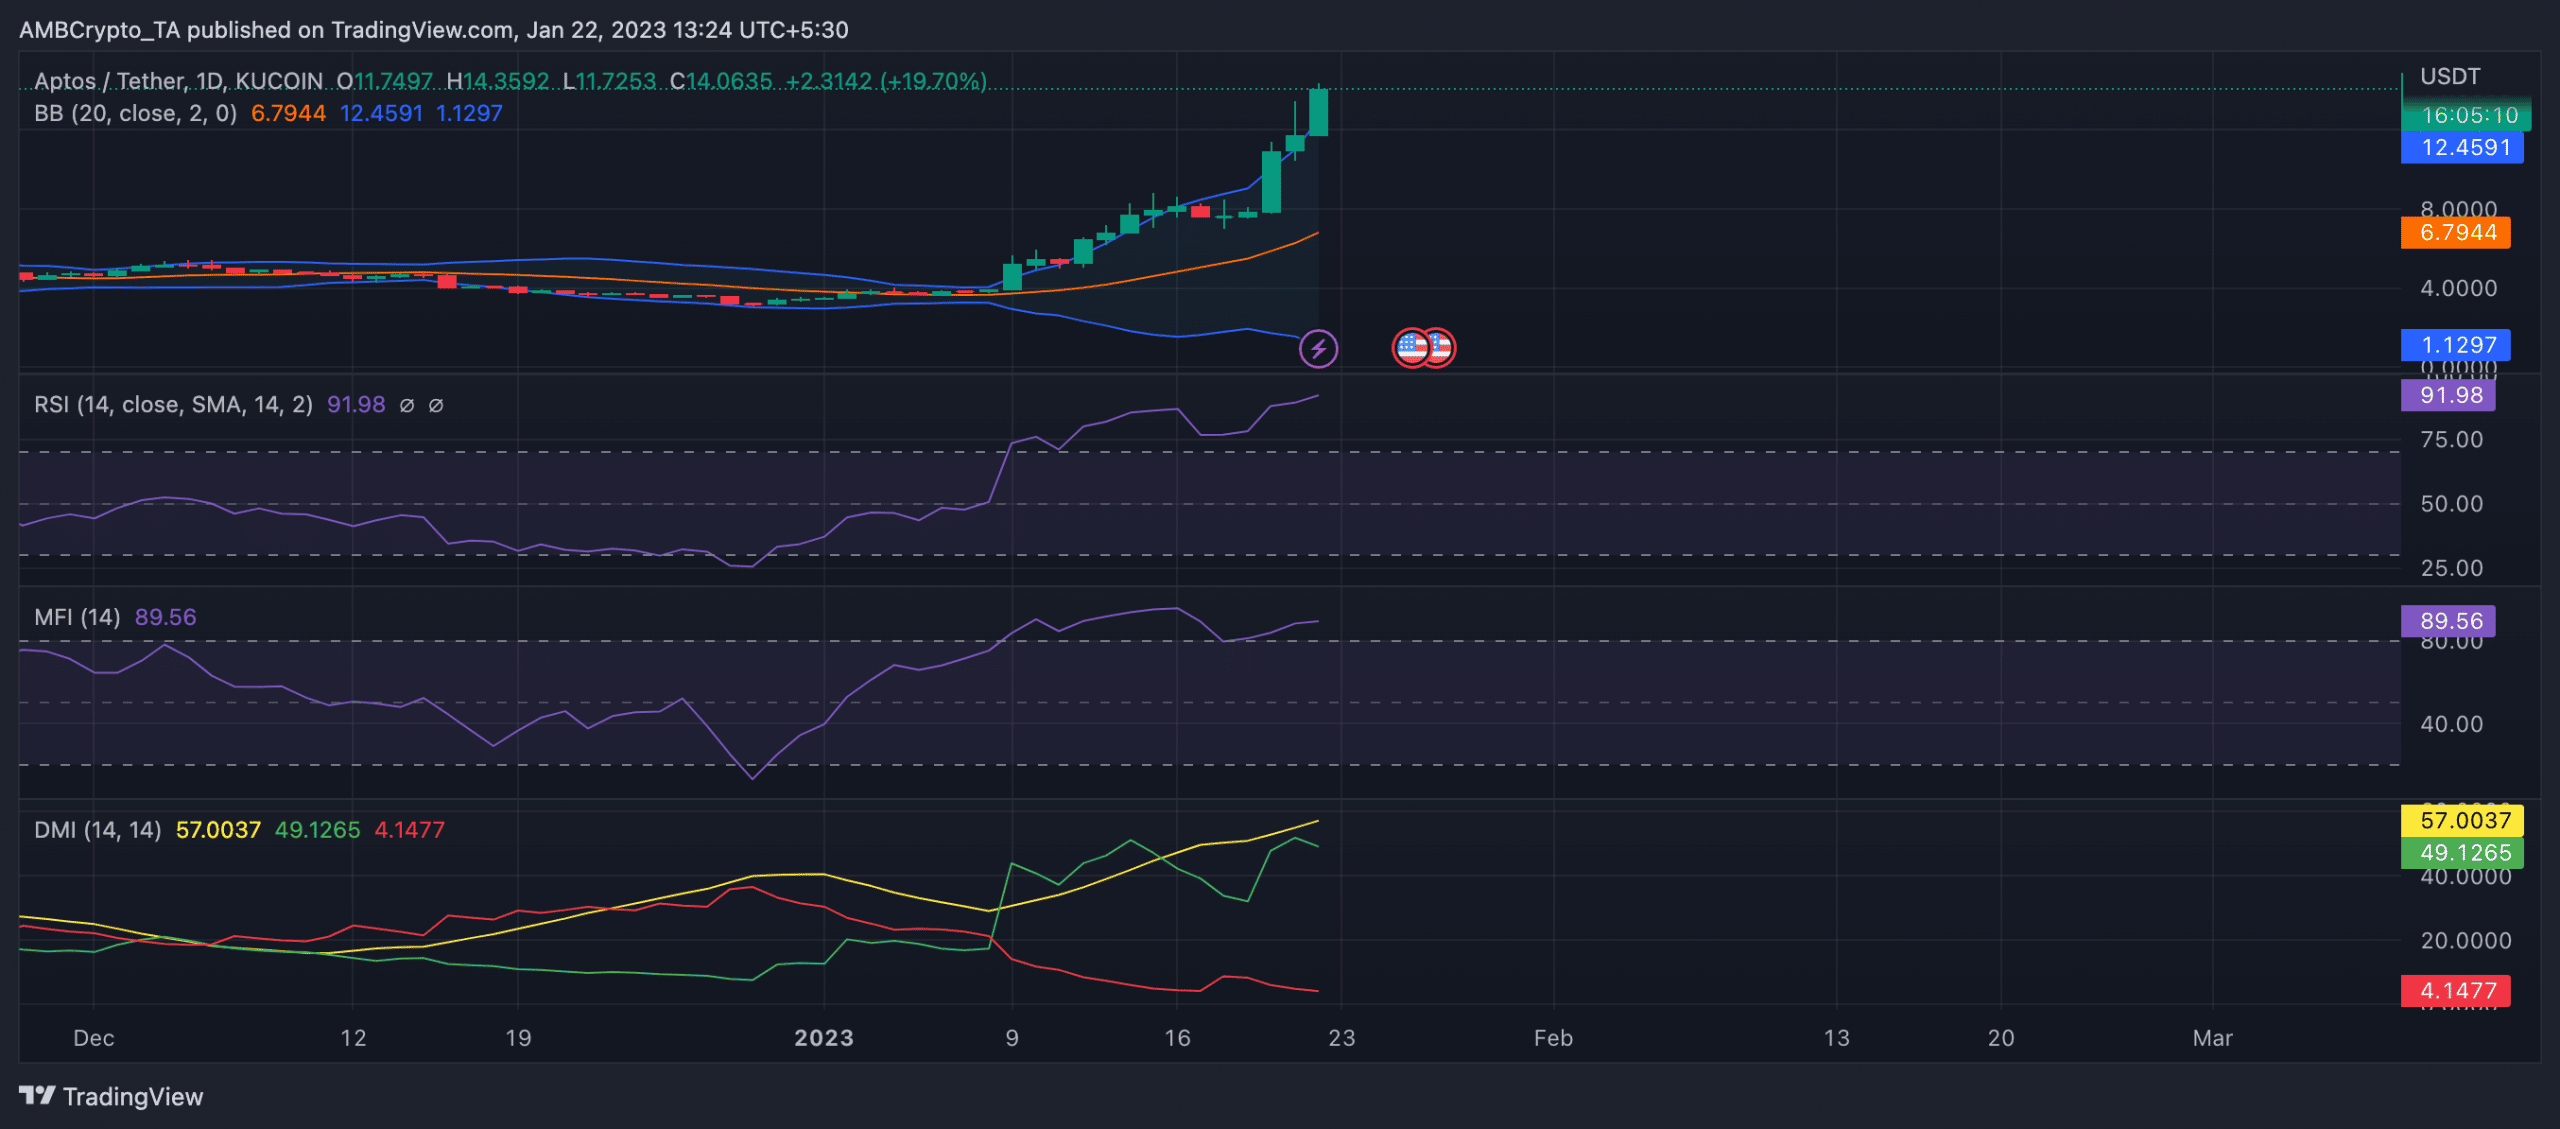
APT on a daily chart
At press time, APT traded at $14.07. Severely overbought as of this writing, the alt’s Relative Strength Index (RSI) rested at 91.98. Similarly, its Money Flow Index (MFI) was at 89.56.
It is key to note that when an asset’s RSI or MFI is “significantly overbought,” it means that the asset’s recent price increases have been substantial and rapid, and the indicators are indicating that the asset is becoming overvalued. This is a signal that the asset’s price may be due for a correction as many will seek to take profit at these levels.
However, sellers might find it difficult to revoke the buyers’ control of the market in the meantime; a look at APT’s Average Directional Index (ADX) revealed this. The ADX line (yellow) oscillates between 0 and 100, with readings above 25 indicating a strong trend and readings below 20 indicating a weak trend.
Is your portfolio green? Check the Aptos Profit Calculator
At press time, the alt’s ADX was 57, indicating that the current bullish trend in the market was strong.
Further, APT’s price was severely volatile at the time of writing and has so been since 9 January. An assessment of the asset’s Bollinger Bands (BB) revealed a wide gap between the upper and lower bands of the indicator.
This typically means that the volatility of an asset is high, and the price is fluctuating significantly. This can indicate that the asset is experiencing high volatility levels, making it more difficult to predict future price movements. Hence caution is advised.