Aptos [APT] chalks a symmetrical triangle – Is a downturn likely?
![Aptos [APT] chalks a symmetrical triangle - Is a downturn likely?](https://ambcrypto.com/wp-content/uploads/2023/04/image-1200x800-23.png)
Disclaimer: The information presented does not constitute financial, investment, trading, or other types of advice and is solely the writer’s opinion
- APT consolidated and formed a symmetrical triangle pattern in the past few days.
- APT saw increased NFT trade volumes in the last few days.
Despite its consolidation in the past few days, Aptos [APT] registered an impressive NFT sales performance. But the price hasn’t registered a strong recovery to match its NFT performance.
APT sustained a price dump in late February and early March, dropping it from $20 to $10. After hitting the $10 level, the attempted recovery ended in a consolidation, chalking a bearish symmetrical triangle pattern.
Read Aptos [APT] Price Prediction 2023-24
Symmetrical triangle pattern – A likely downturn or upswing?
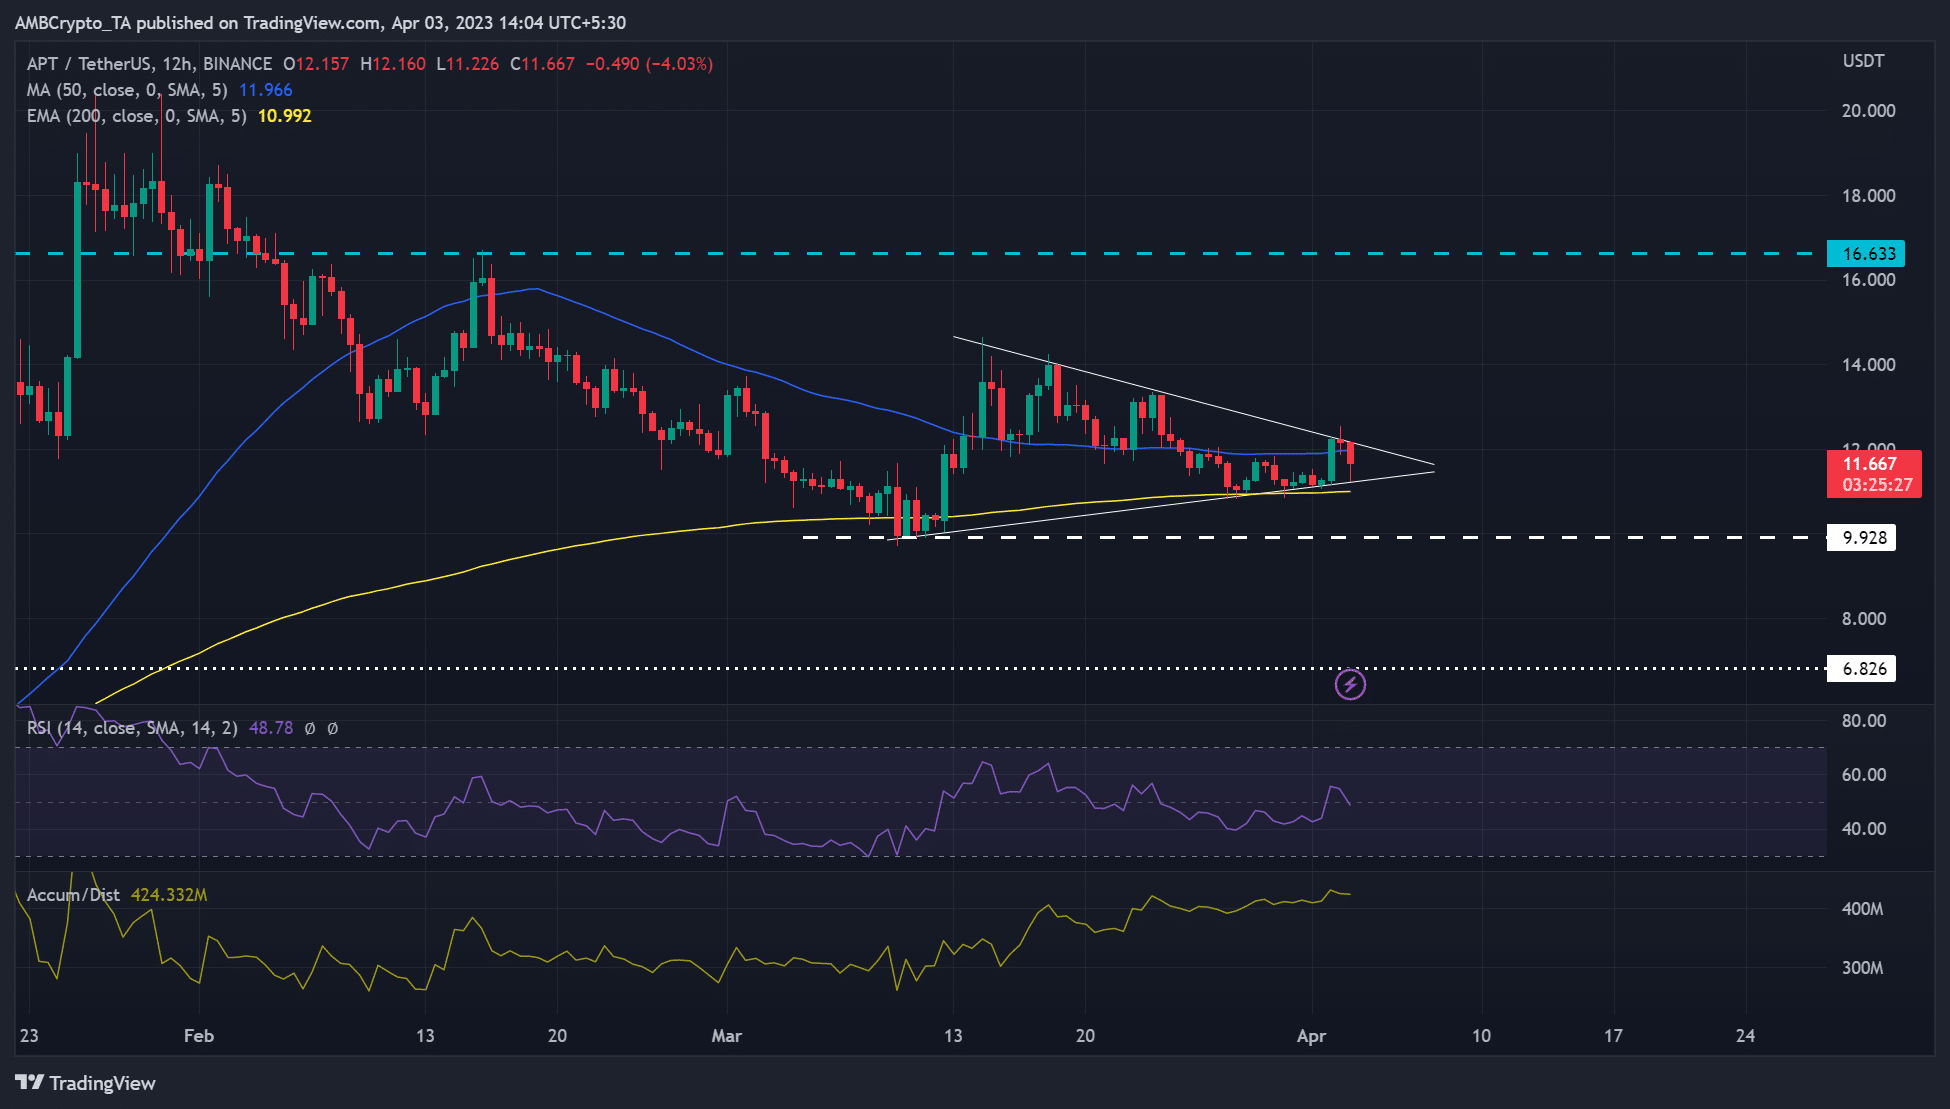
The above chart is a bearish symmetrical triangle pattern based on the previous trend direction before the consolidation. As such, conventional wisdom tips bears for a potential downturn if a breakout occurs. But a bullish Bitcoin [BTC] could spoil the market for bears.
Bears must clear the 200 EMA (exponential moving average) of $10.992 (yellow line) and breach the $9.928 support to dent any bullish sentiment. Such a downturn and leverage could see APT hit the bearish target of $6.826.
However, APT could inflict a bullish breakout if BTC reclaims $28K and surges afterward. The immediate target for bulls would be $16, but bulls must overcome the hurdle of $14. A close above $16.633 could incentivize bulls to aim at the stiff overhead resistance of $20.
At press time, the RSI (Relative Strength Index) dropped to the lower range but recovered to the neutral level. It shows buying pressure improved, but the structure was neutral at the time of writing.
Interestingly, the Accumulation/Distribution indicator surged since 13 March, showing APT enjoyed massive accumulation in the same period.
NFT trade volumes increased: development activity dipped
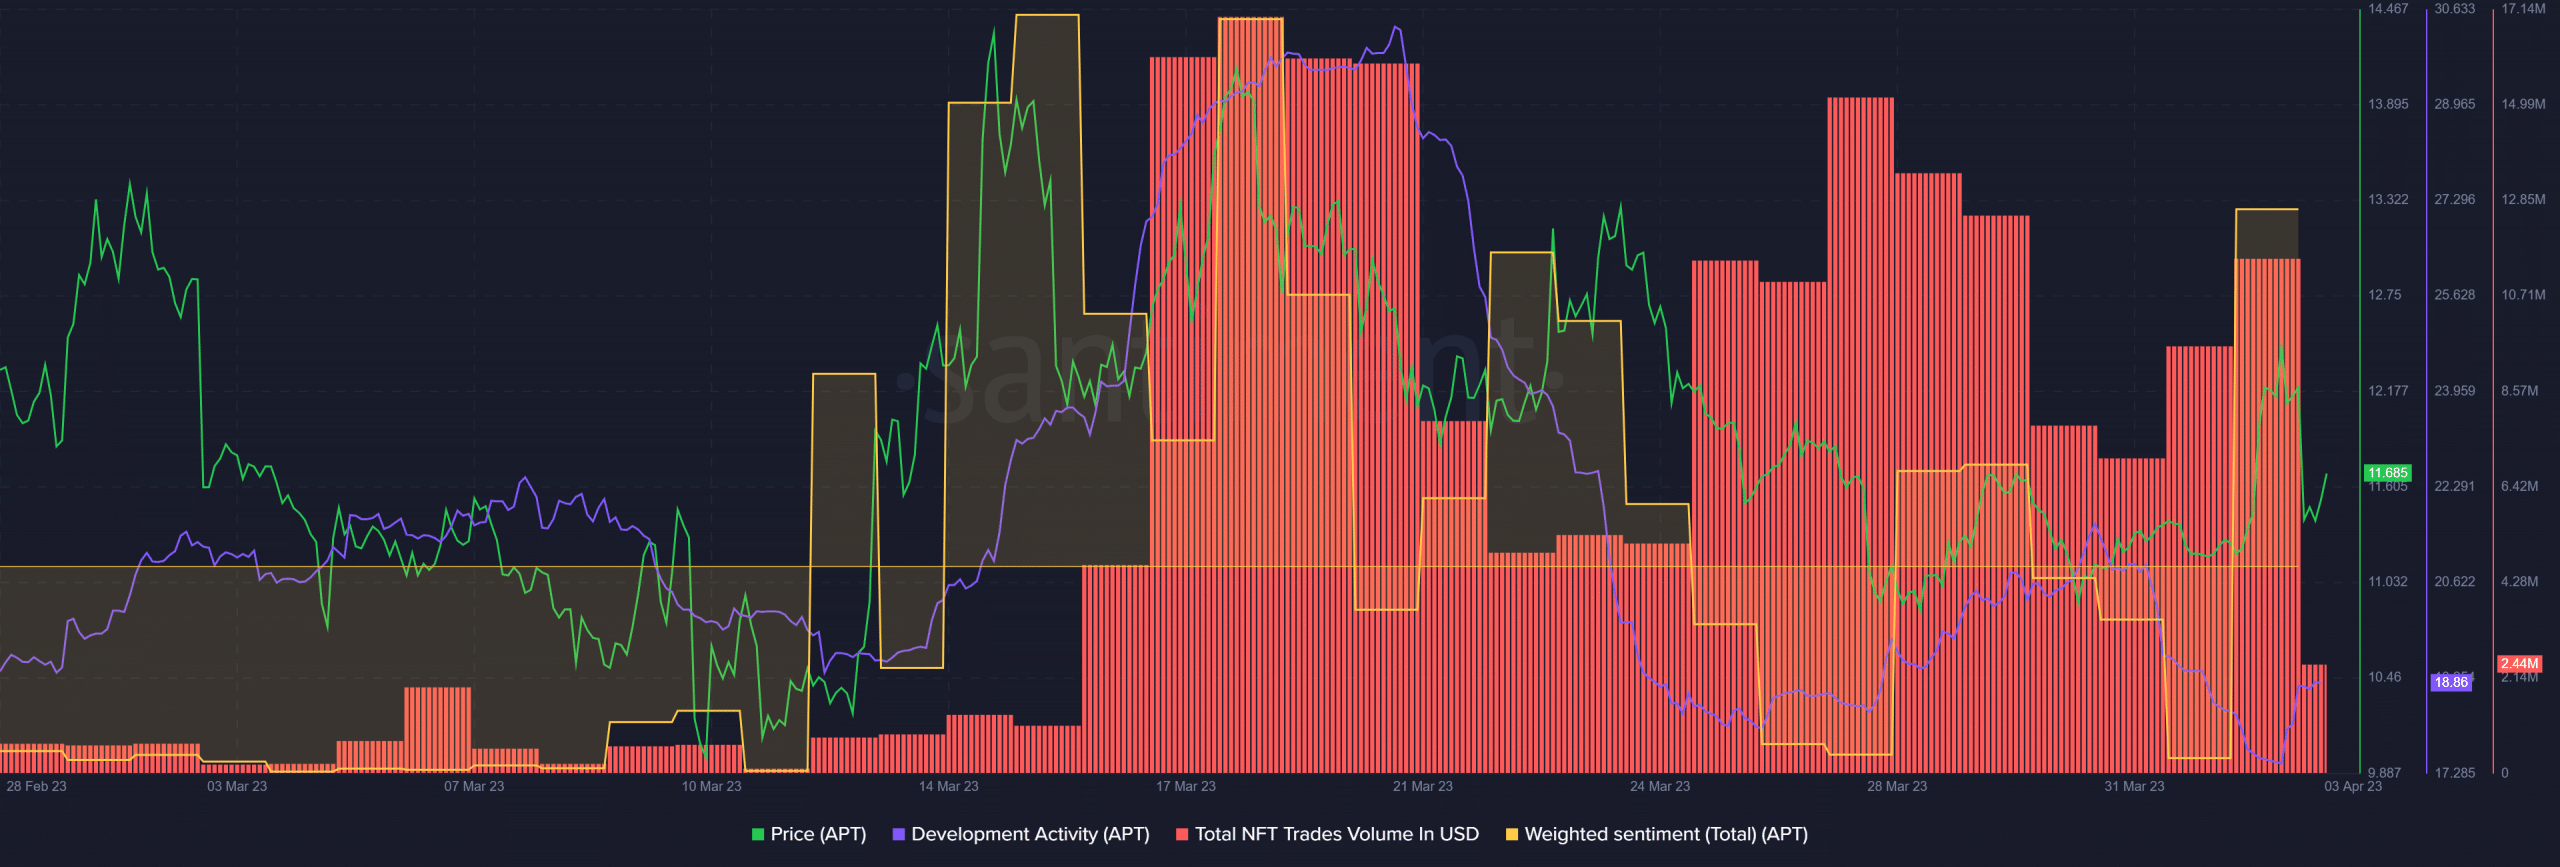
According to Santiment, the Aptos network saw increased NFT trade volumes since mid-March, with an average of about $8.5M. This could attract more users, increase revenue, and improve investors’ confidence in native APT tokens.
How much is 1,10,100 APTs worth today?
But fluctuations in development activity significantly affected investors’ outlook as dips led to a decline in weighted sentiment while a surge improved it.
The sentiment improved at the time of writing, which could tip APT for a likely bullish breakout. But investors should track BTC’s price action before making moves.