Aptos fails to deliver but keeping a close eye on APT could be on the investor radar

Aptos [APT] investors might have expected much from the recently launched network. However, the blockchain repeatedly showed why it might be difficult to “refine the web3 experience” for its users.
Wonder why? Well, on 21 October, Aptos Explorer revealed that the network was processing only eleven Transactions Per Second (TPS). For a blockchain that was dubbed the “Solana Killer”, this was an unimpressive rate.
Fast forward to 5 November, the story witnessed a change. Yet, it was nowhere close to the thousand of transactions that many investors looked forward to. As of 5 November, Aptos Explorer showed that the TPS of the network was 19, with validators remaining at 102.
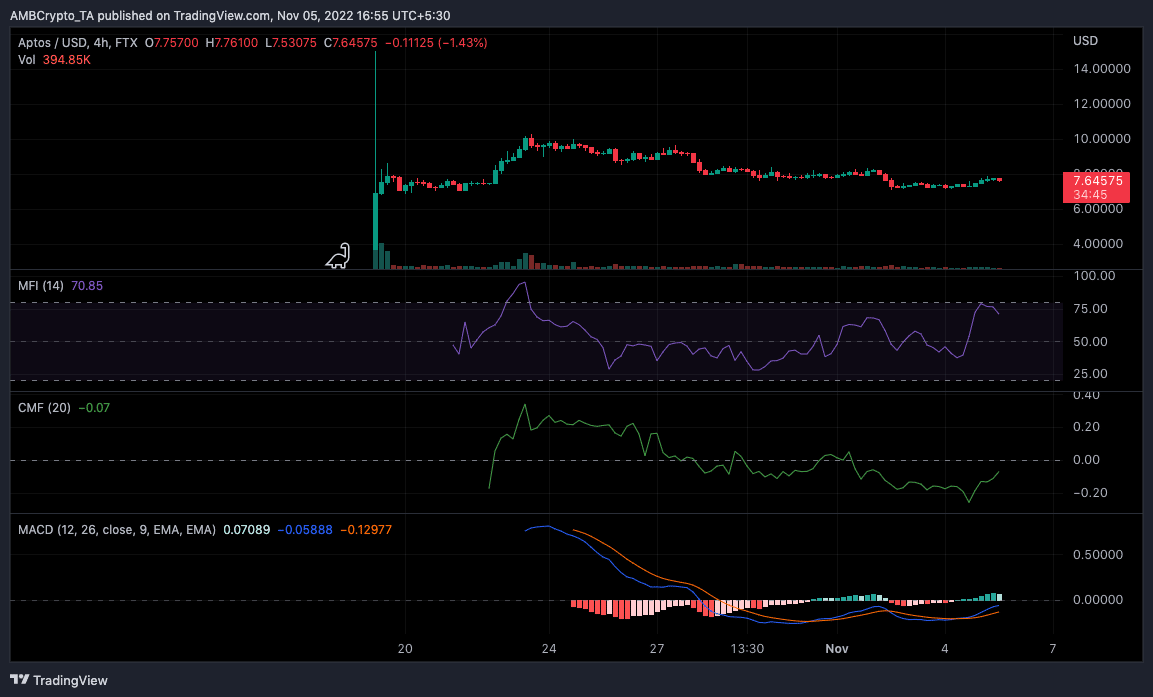
Additionally, APT’s performance suffered a correction by 0.19% in the last 24 hours and was exchanging hands at $7.71 at the time of writing.
The APT trend might interest you
The Aptos increase signified a revival from its massive dump to $7.19 from $8.23 on 2 November. However, the rejuvenation might have been impossible without some underlying factors. Besides the 58% volume increase, APT’s four-hour chart showed that the Chaikin Money Flow (CMF) had exited the -0.24 zone it was on 4 November.
With its value at -0.07, it was evident that investors had filled up the network with enough liquidity. This implied that APT had been able to generate immense interest from the crypto community lately.
Additionally, the above chart showed the trend of the Money Flow Index (MFI). As for the MFI, an incredible amount of money had entered Aptos such that it hit the overbought level of 77.88. As expected, the MFI trend had reversed and was now close to maintaining an excellent buying level.
Despite the reversal, there was no confirmed sign of selling pressure. In fact, the Moving Average Convergence Divergence (MACD) indicated that although slight, buyers (blue) were still in control over sellers (red). However, the failure to rise above the MACD histogram might keep APT at bay of falling to the demands of sellers. So, the increase in the APT price was not a signal for an unbreakable resolve to decrease in value.
Will the chain redeem APT?
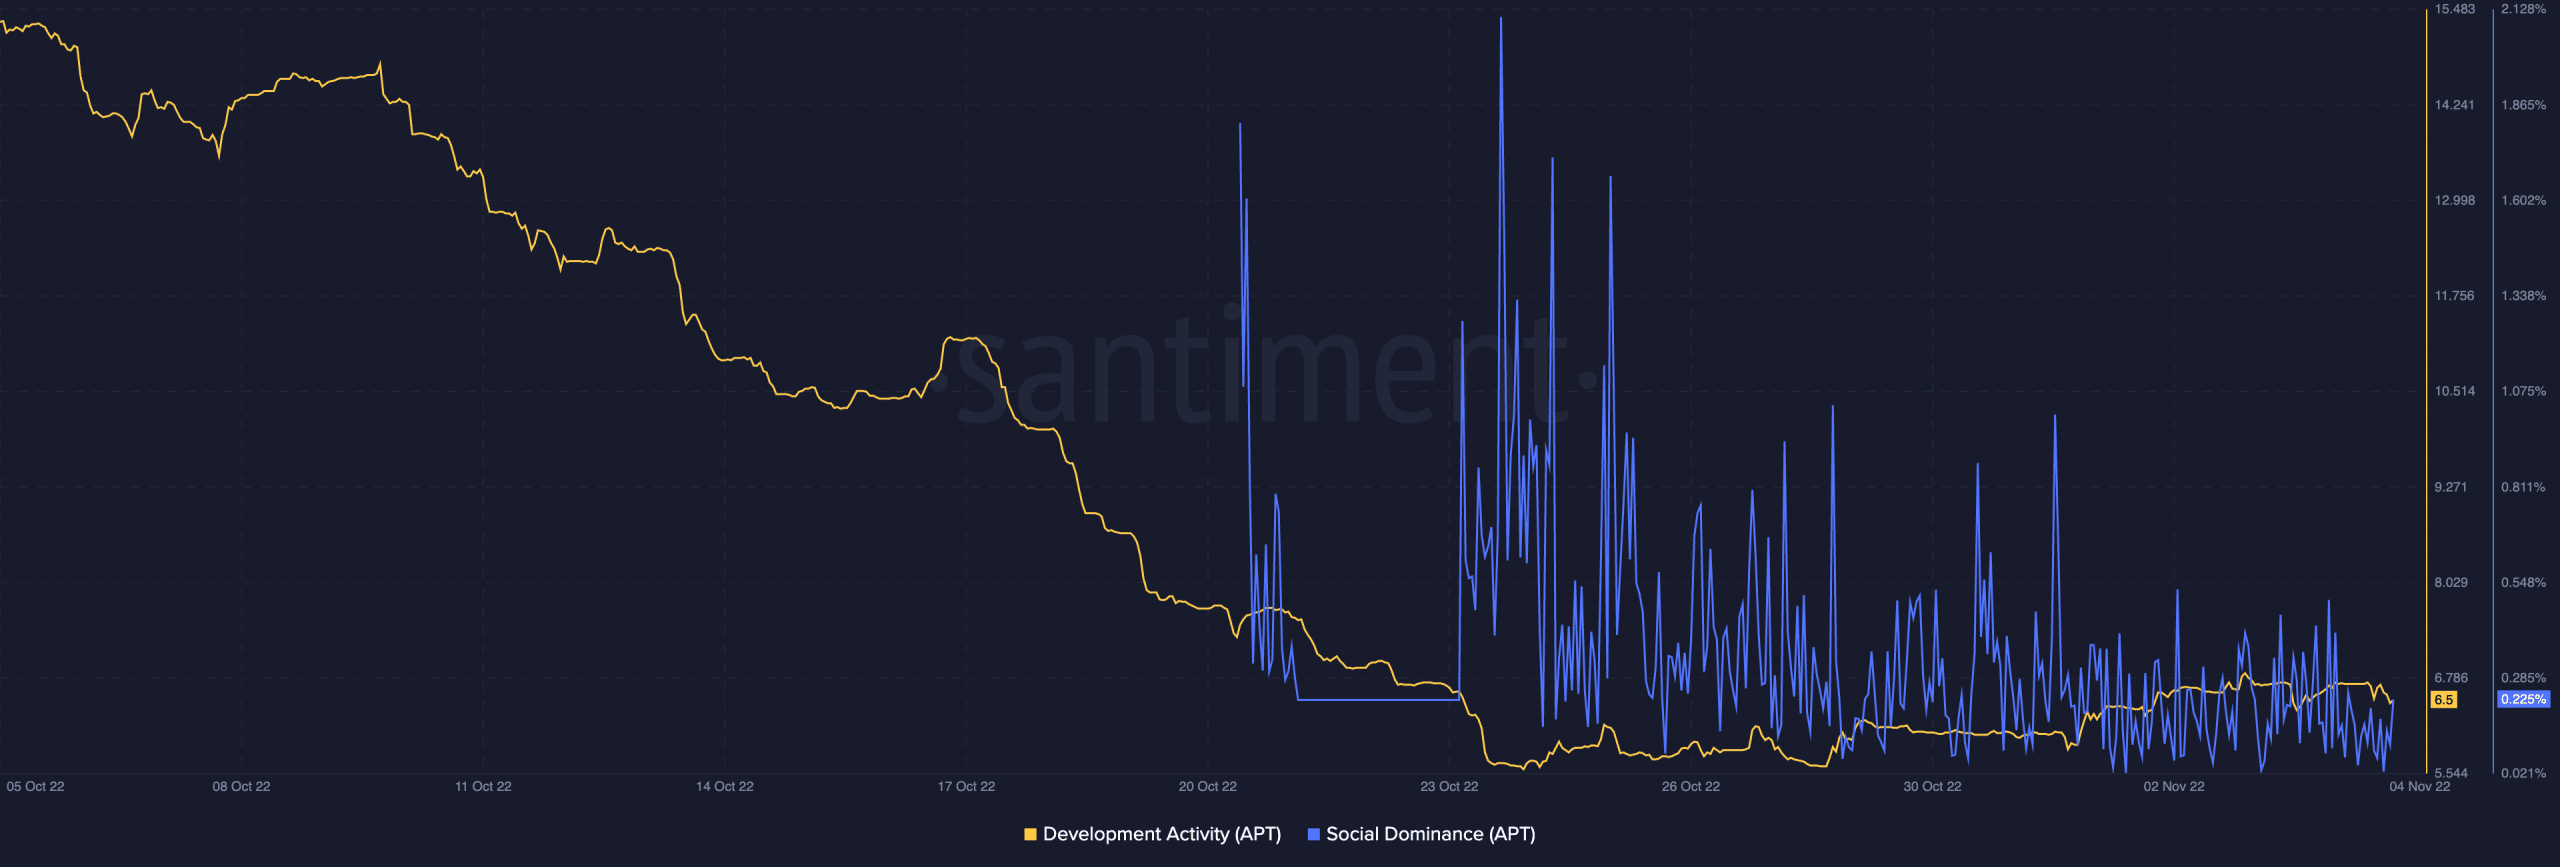
Per on-chain analysis, it seemed that Aptos was struggling to adapt to the reality of the market. This was because its initial dominance that helped it sparked in socials and search had obviously decreased.
At press, Santiment showed that its social dominance on 5 November was 0.225%— a massive fall from 2.105% on 24 October. Development activity was also nowhere near highs. At 6.5, the signs were similar to that of an abandoned ship. However, this might not be enough to bother APT investors especially as APT did not look like it needed a superb on-chain performance to thrive.


