Are Solana bulls gathering momentum?
The Solana technical indicators showed a strong bullish trend in progress, but were the findings from the CVD a precursor to a deeper pullback?

Disclaimer: The information presented does not constitute financial, investment, trading, or other types of advice and is solely the writer’s opinion.
Solana [SOL] has performed well since last Friday. The bulls were able to defend the $19.2 support level.
Moreover, they managed to push prices past a strong short-term resistance over the weekend. It was likely that further gains would follow after the price action that developed in the past week.
The latest Solana network update brought some highly anticipated features. Shortly after the announcement, prices saw a pullback.
Could this minor pump be just a sell-off after the news? Or was it the beginning of a larger rally?
Solana bursts past the $20 psychological level on high volume
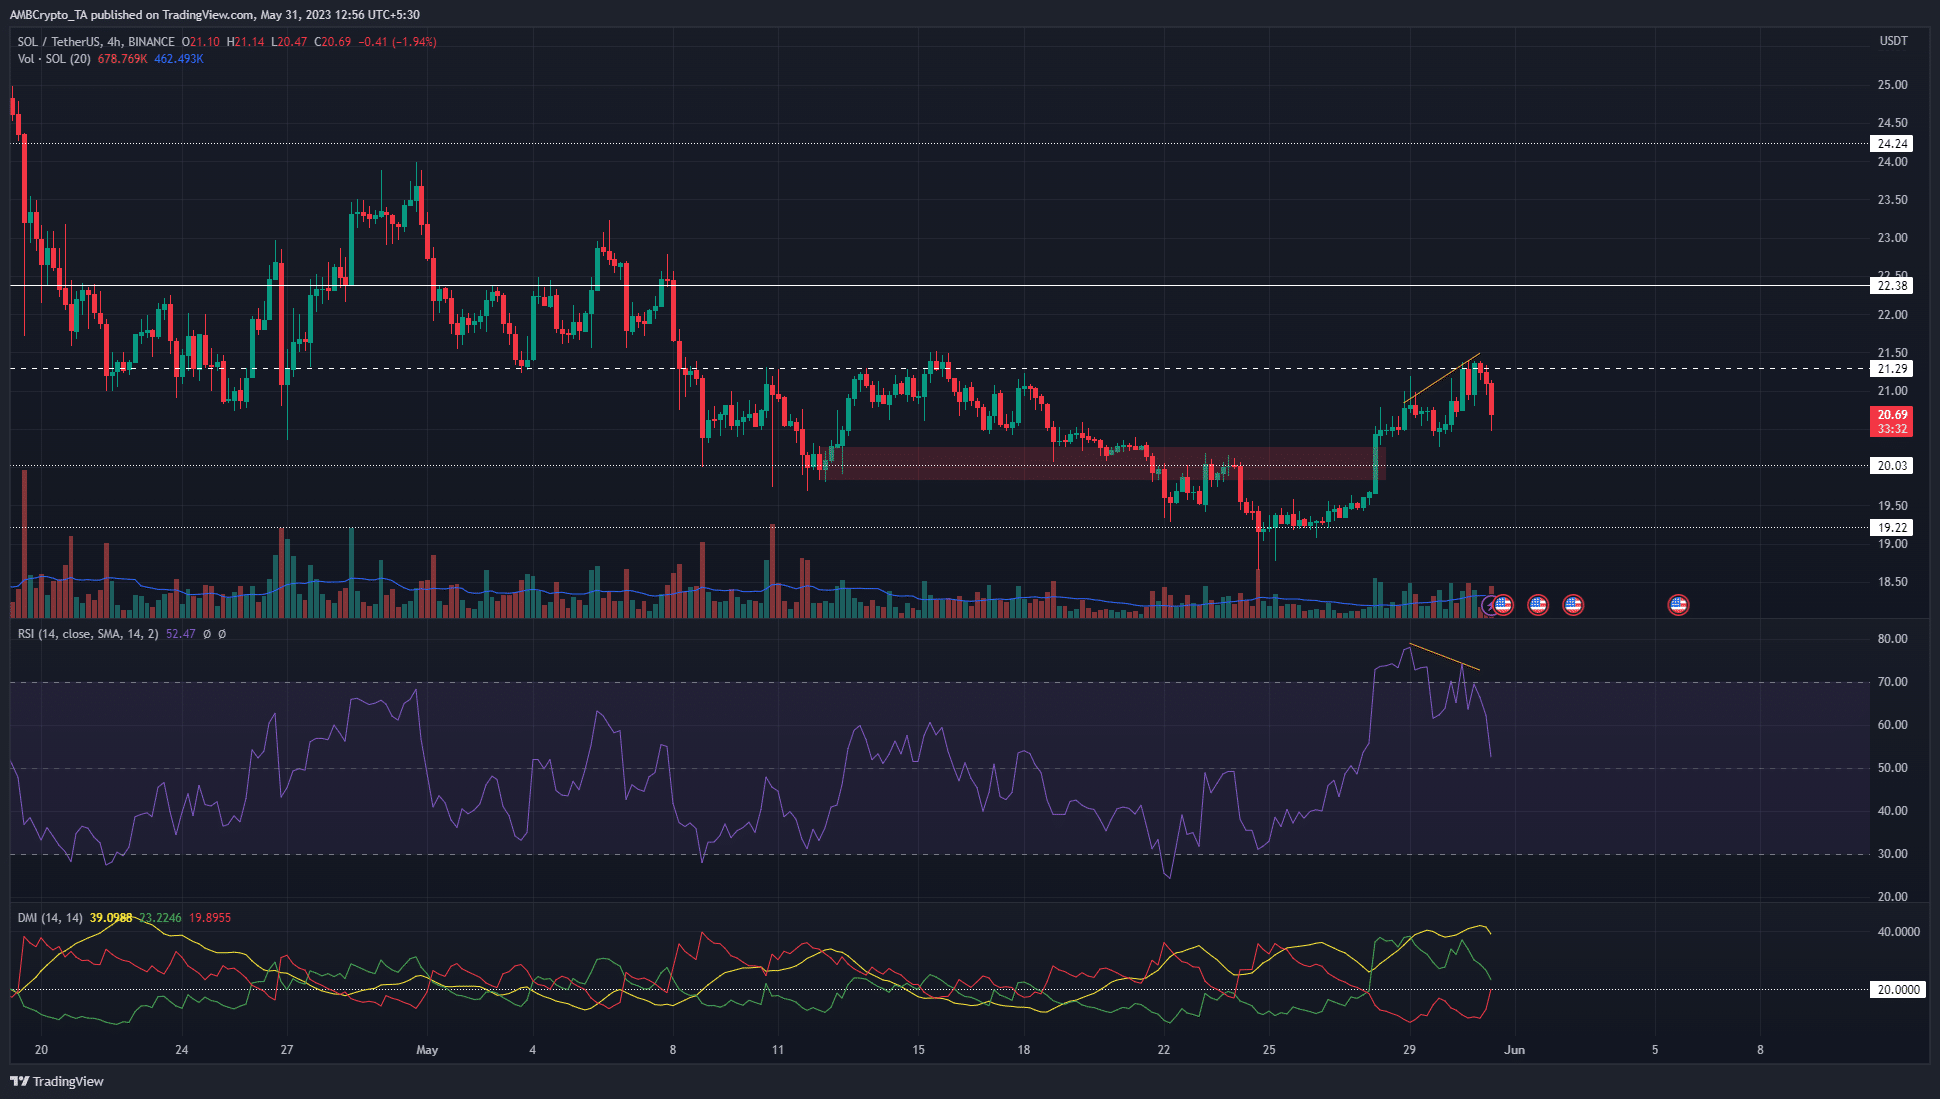
The bullish order block from 12 May on the 4-hour chart was flipped to a bearish breaker and retested as resistance on 24 May. A week ago, the momentum was bearish and SOL was forced to retreat to the $19.2 support.
From there, the bulls were able to mount a comeback. Since Monday Solana was able to register rapid gains and swiftly break past the bearish breaker block. It did so by leaving an imbalance on the charts, which signaled the strength of the bullish move.
At the time of writing, the H4 market structure was strongly bullish, despite the rejection at $21.3. The rejection came after a bearish divergence between the price and the RSI.
The $20.35-$20.45 short-term support zone could be tested before another move upwards.
The RSI remained above neutral 50, suggesting momentum of Solana has not yet flipped bearish. The DMI also showed a strong uptrend in progress with both the +DI (green) and ADX (yellow) above the 20 value.
The decline in spot CVD raised concerns about the bullish conviction
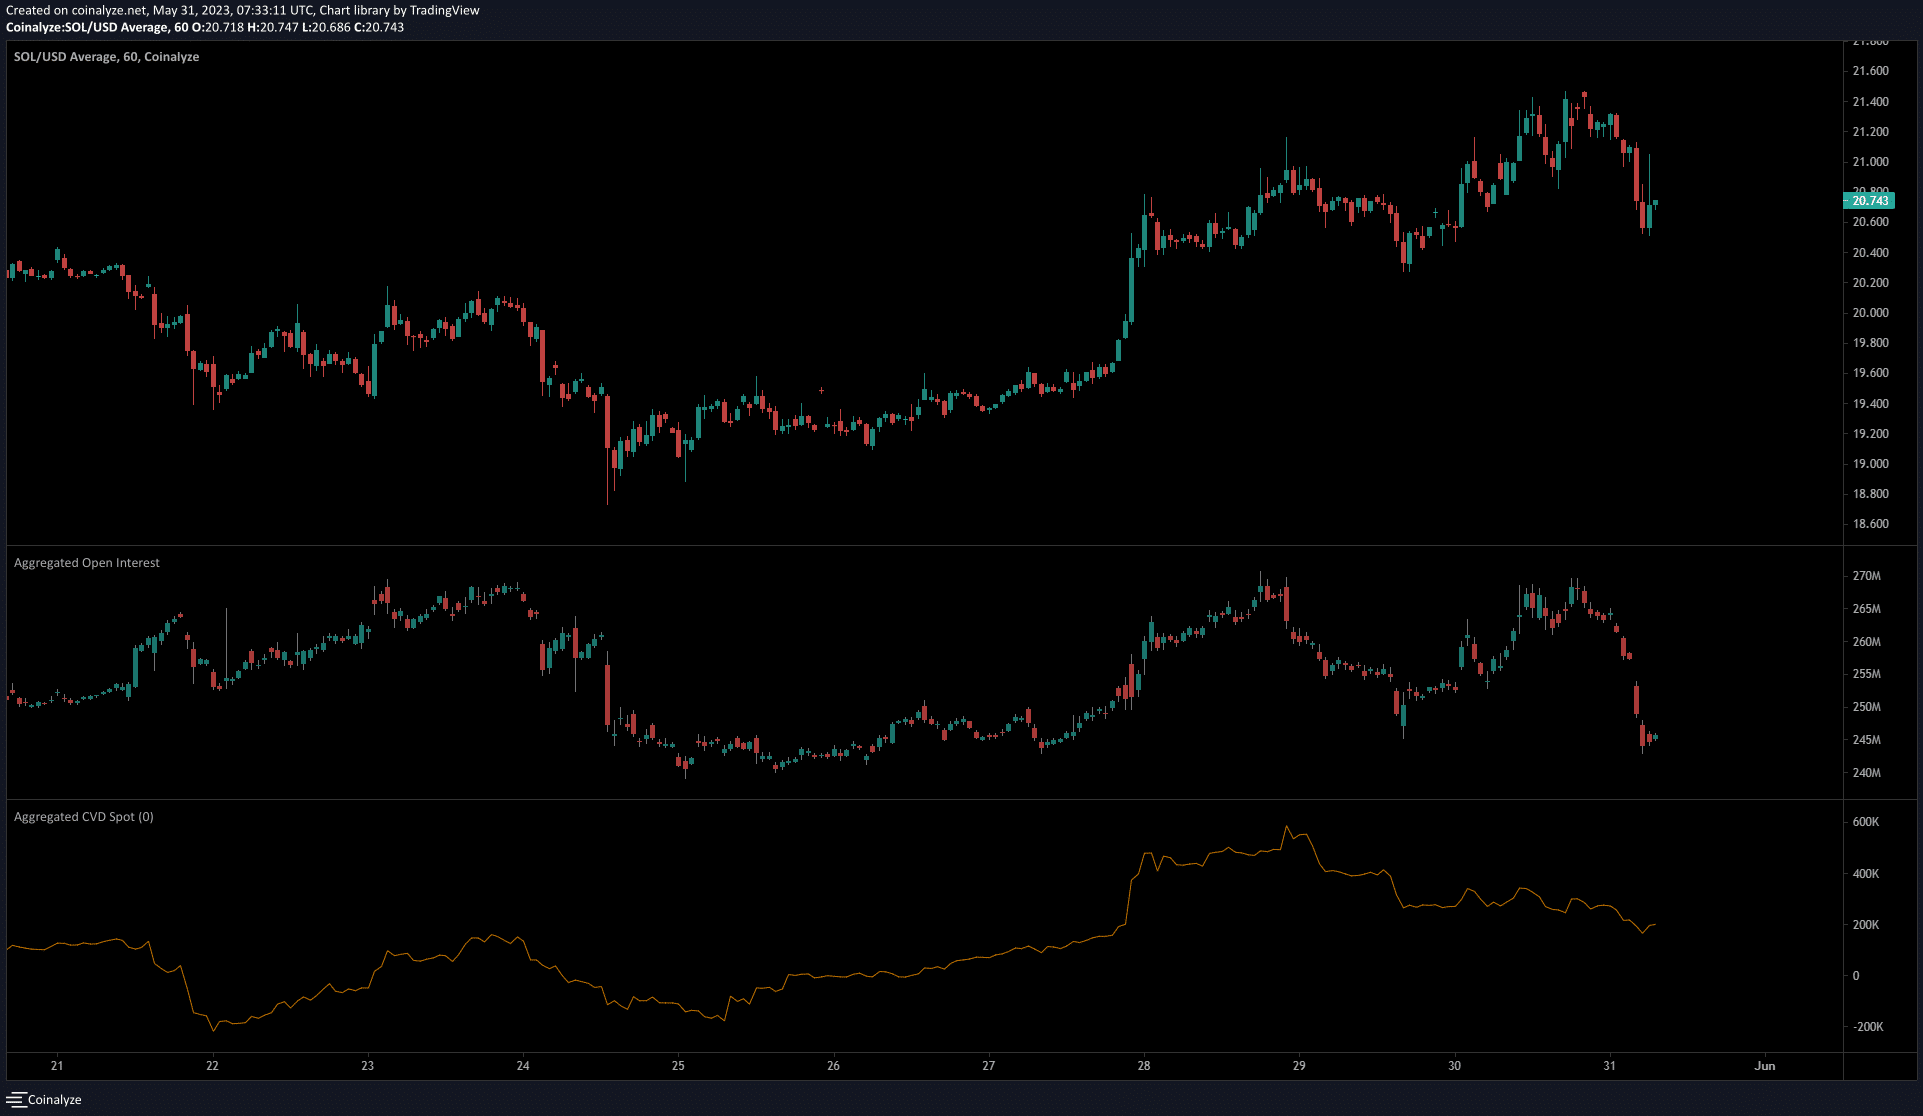
From 29 May, the spot Cumulative Volume Delta on the 1-hour chart was in decline. Coinalyze data also showed a steep drop in Open Interest upon the rejection from the $21.3 resistance.
How much are 1, 10, or 100 SOL worth today?
Taken together they show strong short-term bearish sentiment. The drop in OI represented discouraged long positions. This could change if the CVD begins to tick higher. Yet, the falling CVD with rising prices suggested the rally might not be spurred organically.
The price action indicated that buying SOL at the $20.5 area could represent a good risk-to-reward trade targeting the next highs at $22.4.


