
- Bitcoin short-term whales are underwater, which likely presented an ideal buying opportunity
- Metrics resembled how they were before the previous major bull run
Bitcoin [BTC] sank below the key demand zone at $60k.
This region had held the sellers at bay but eventually gave way. Crypto technical analyst CrypNuevo highlighted that we might get a post-FOMC bounce to $61k in a post on X (formerly Twitter).
Should traders expect to see the $60k former support reclaimed? Alternatively, should they look to go short upon a retest? Here’s what market participants could watch out for before making their next move.
The current breakdown has been on a high trading volume
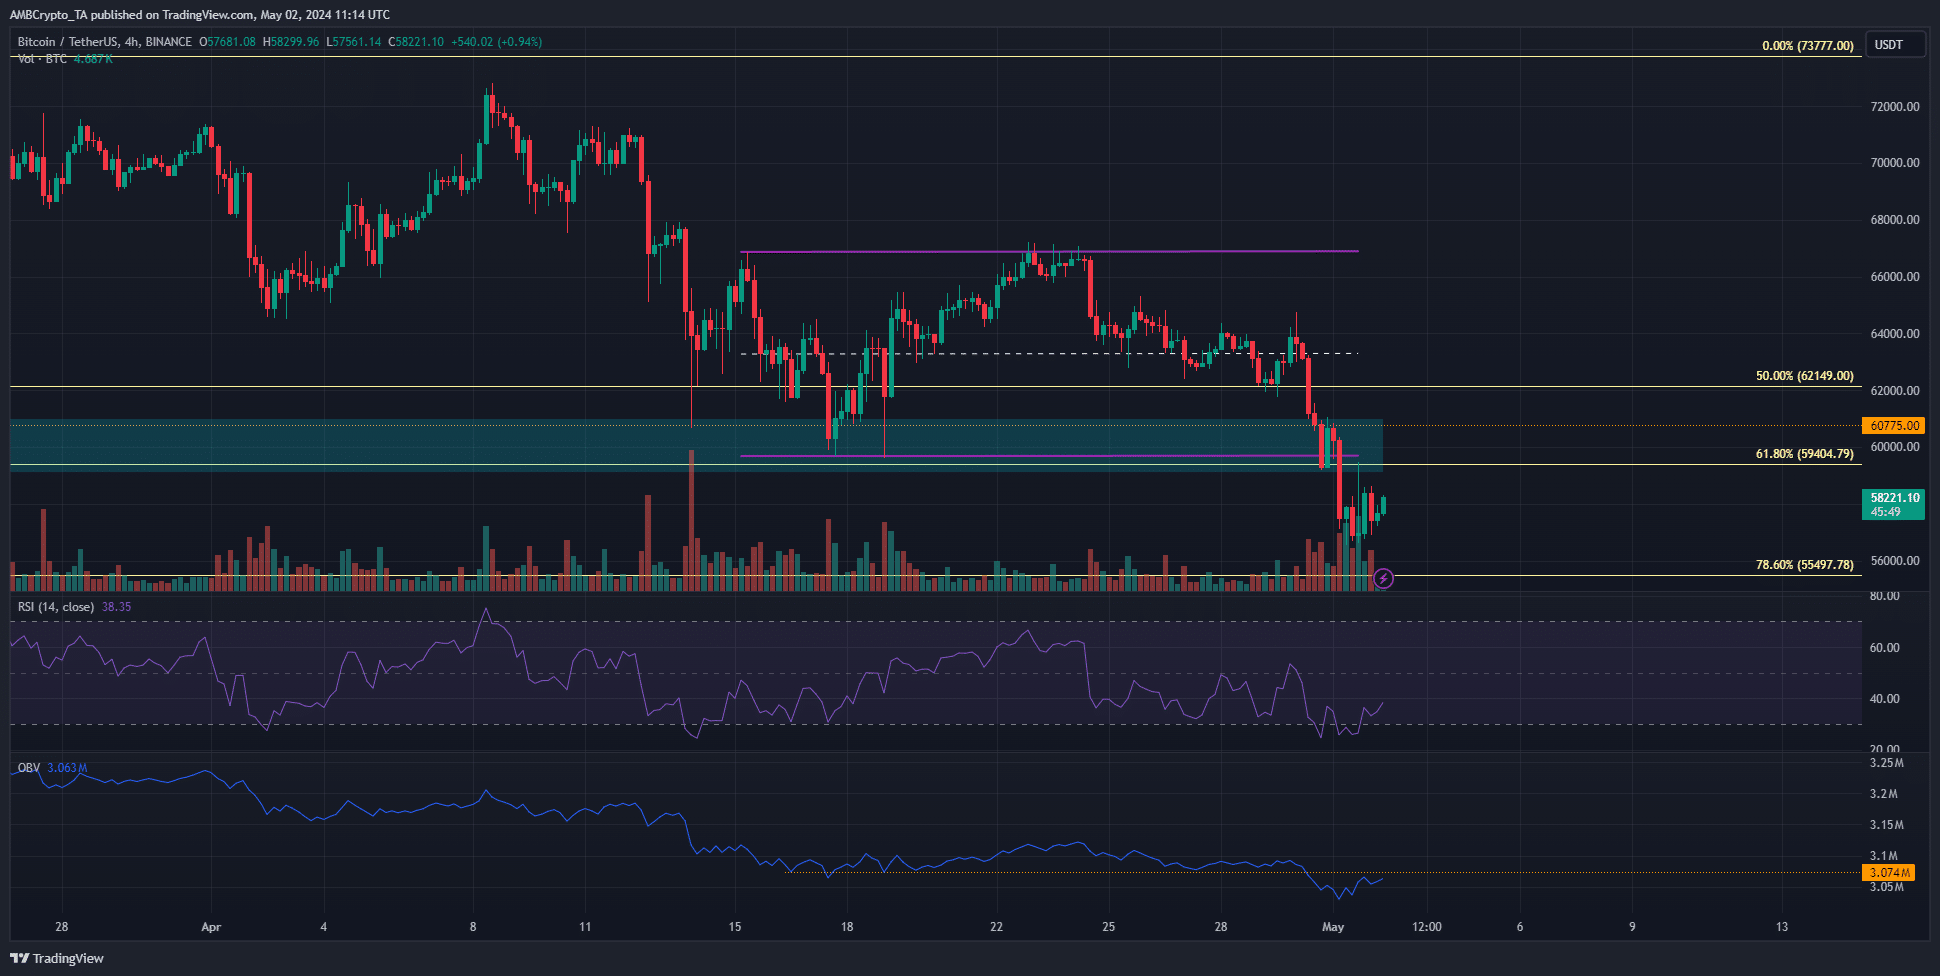
Source: BTC/USDT on TradingView
The key levels are $59.4k and $60.7k in the short term. A cluster of liquidity is likely present near these levels, marking them as critical areas where a bearish continuation could occur.
Such a continuation is expected because the OBV has fallen below two-week support, highlighting selling pressure dominance.
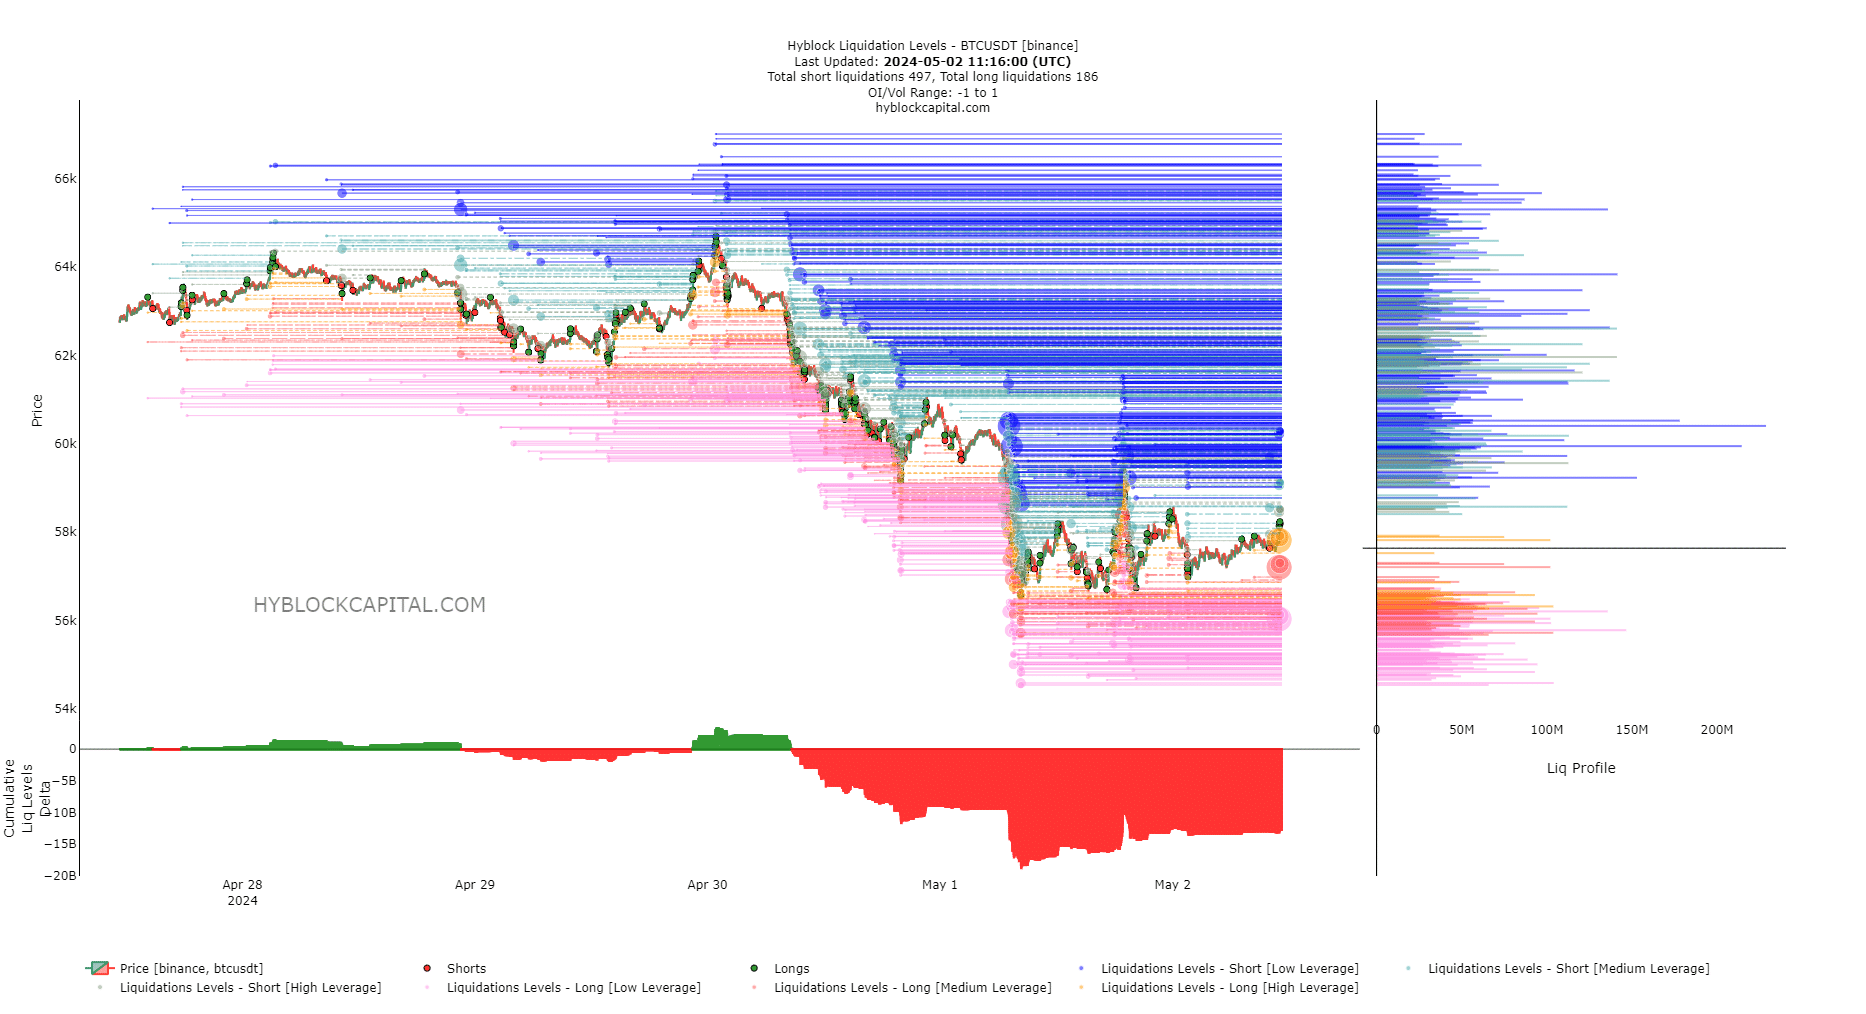
Source: Hyblock
The liquidation levels showed that the cumulative liq levels delta was vastly negative. Therefore, we can expect a move upward in the short-term to collect liquidity and wipe out the imbalance.
The $60.5k and the $63.8k levels had the highest cluster of liquidation levels. Hence, a move to these levels before a reversal southward is anticipated.
Of golden and death crosses
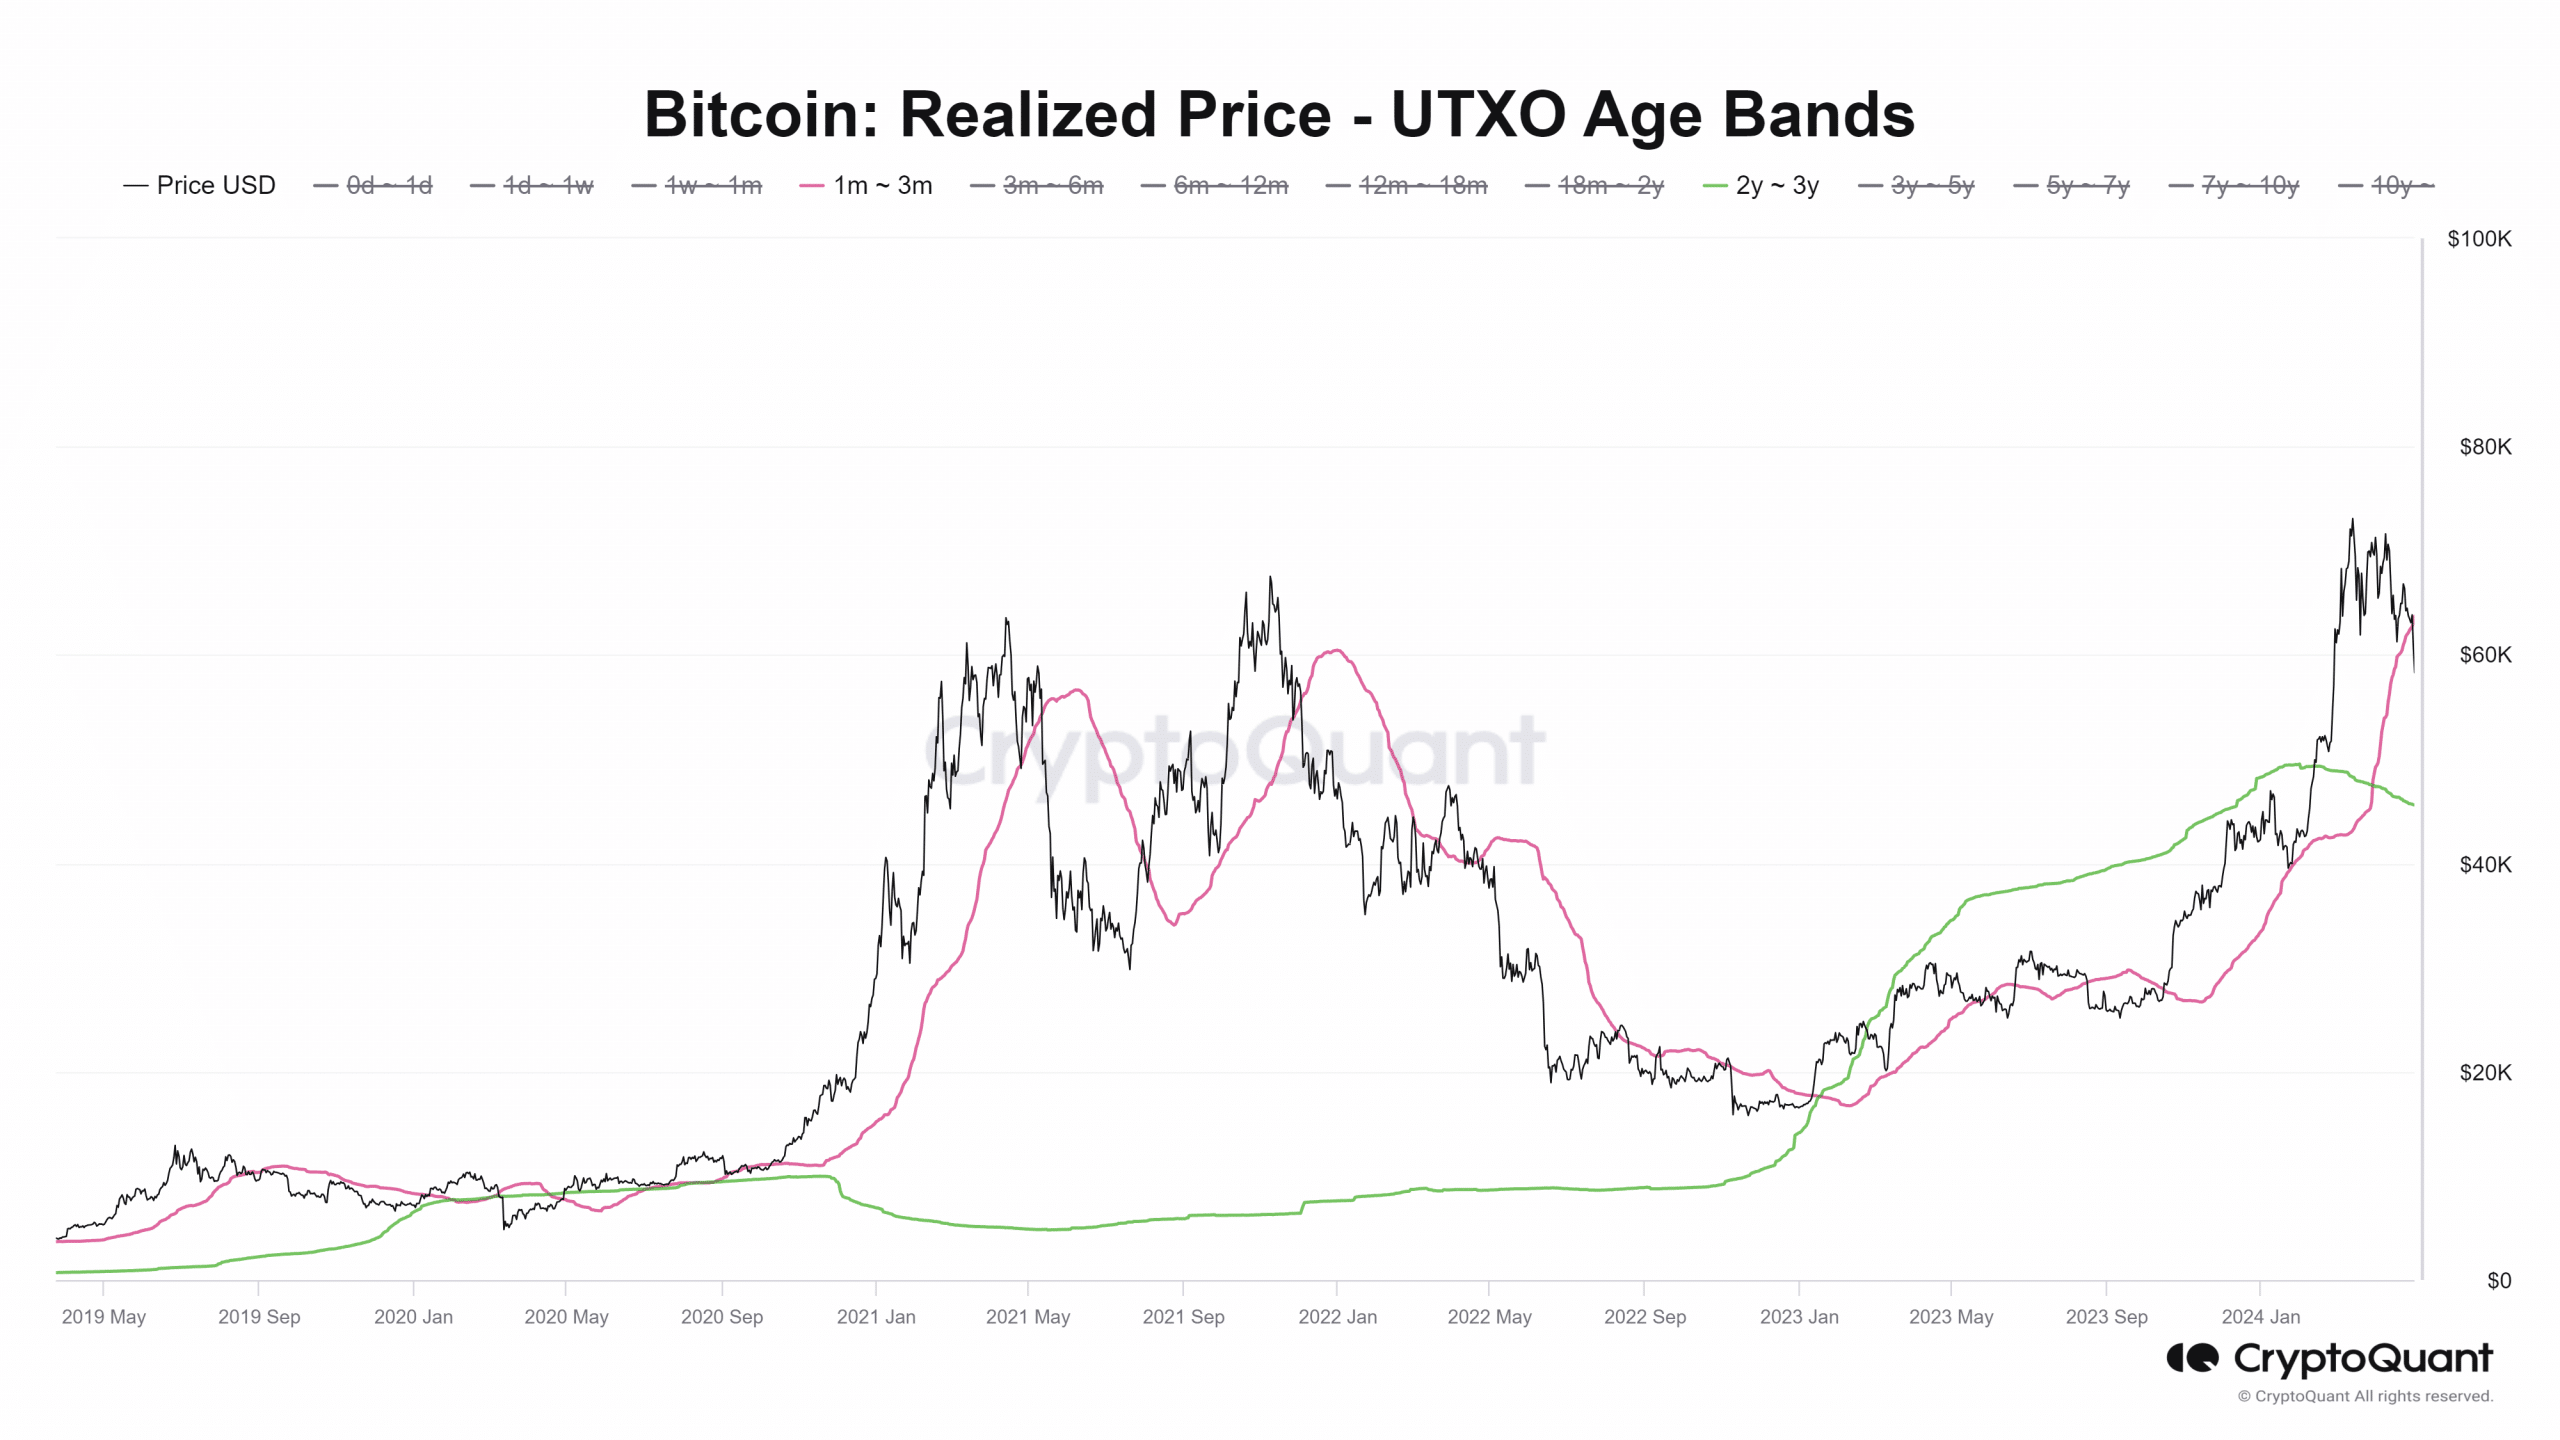
Source: CryptoQuant
In a CryptoQuant Insights post, user CoinLupin pointed out an interesting development.
Looking at the realized UTXO age bands, the onset of major bull runs came when the realized price of 1-3 month and 2-3 year bands saw a smoothing process.
This happened in 2020 from January to September, and prices tend to consolidate near the realized prices of these age bands.
Read Bitcoin’s [BTC] Price Prediction 2024-25
In the current cycle, there were not as many golden and death crosses between these two age bands.
However, the recent pullback could be followed by deeper losses as savvy market participants buy from impatient BTC sellers. This could be followed by the true bull run, the analyst pointed out.