- Despite a price increase, bullish sentiment around BNB declined.
- Most on-chain data looked pretty bullish on the coin.
Binance Coin [BNB] was among the few top cryptos that managed to paint their daily charts green. There was more to the story, as the coin was consolidating inside a bullish pattern.
In the event of a breakout, it might soon target $800. Let’s see what’s going on with BNB.
BNB’s bullish move
CoinMarketCap’s data revealed that BNB’s price increased by more than 3.5% in the last 24 hours. This was commendable, as most other cryptos struggled during the same period.
At the time of writing, the coin was trading at $539.01 with a market capitalization of over 478.6 billion.
However, the recently gained bullish momentum didn’t have a positive impact on the coin’s Social Volume, which declined over the last few days, per AMBCrypto’s look at Santiment’s data.
Its Weighted Sentiment also declined, as bullish sentiment around the coin plummeted.
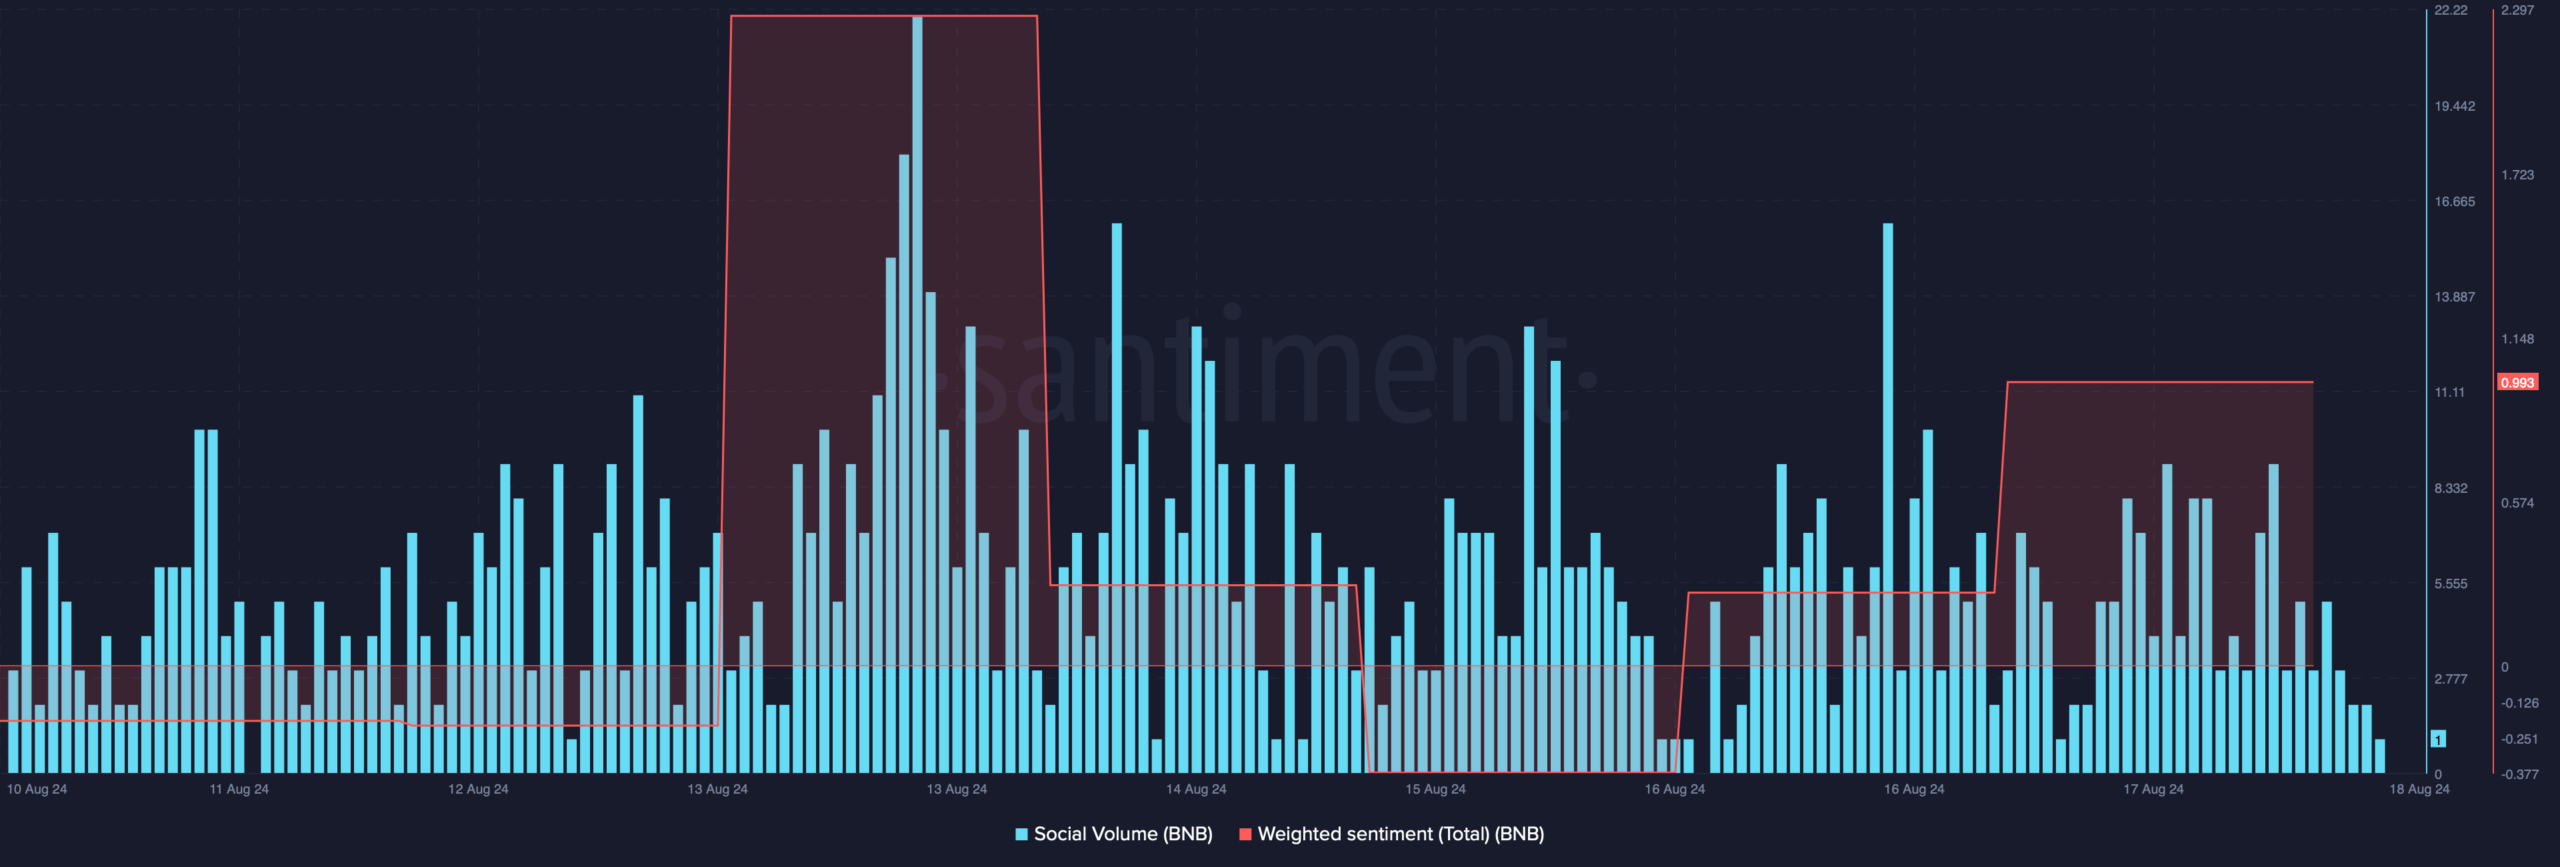
Source: Santiment
While this happened, World Of Charts, a popular crypto analyst, recently posted a tweet highlighting a bullish pattern on BNB’s chart.
As per the tweet, a falling wedge pattern emerged on the coin charts in March.
Since then, the token’s price has been consolidating inside it, and at press time, it was showing signs of a breakout. The tweet also mentioned that if a breakout happens, then BNB might touch $800.

Source: X
Is a bullish breakout possible?
AMBCrypto planned to take a closer look at BNB’s current state to understand the odds of a bullish breakout. Our look at Hyblock Capital data revealed that BNB’s whale vs. retail delta had a value of 100.
This clearly suggested that whales were having longer exposure in the market, which can be inferred as a bullish signal.

Source: Hyblock Capital
Also, Coinglass’ data revealed that the coin’s Long/Short ratio increased, meaning that there were more long positions in the market than short positions.
However, at the time of writing, BNB’s Fear and Greed Index was in a “greed” phase. Whenever the metric hits that level, it indicates that there are chances of a price correction.

Source: CGFI.io
Therefore, AMBCrypto assessed the coin’s daily chart to better understand what to expect. The technical indicator MACD displayed a bullish crossover.
Its Chaikin Money Flow (CMF) also registered an uptick, hinting at a continued price rise.
Realistic or not, here BNB’s market cap in BTC’s terms
However, the Relative Strength Index (RSI) turned bearish as it moved sideways. In case of a continued price rise, BNB has to go above its resistance levels at $602 and $710 before eyeing at $800.
But if the bears take over, then the coin might plunge to $461.
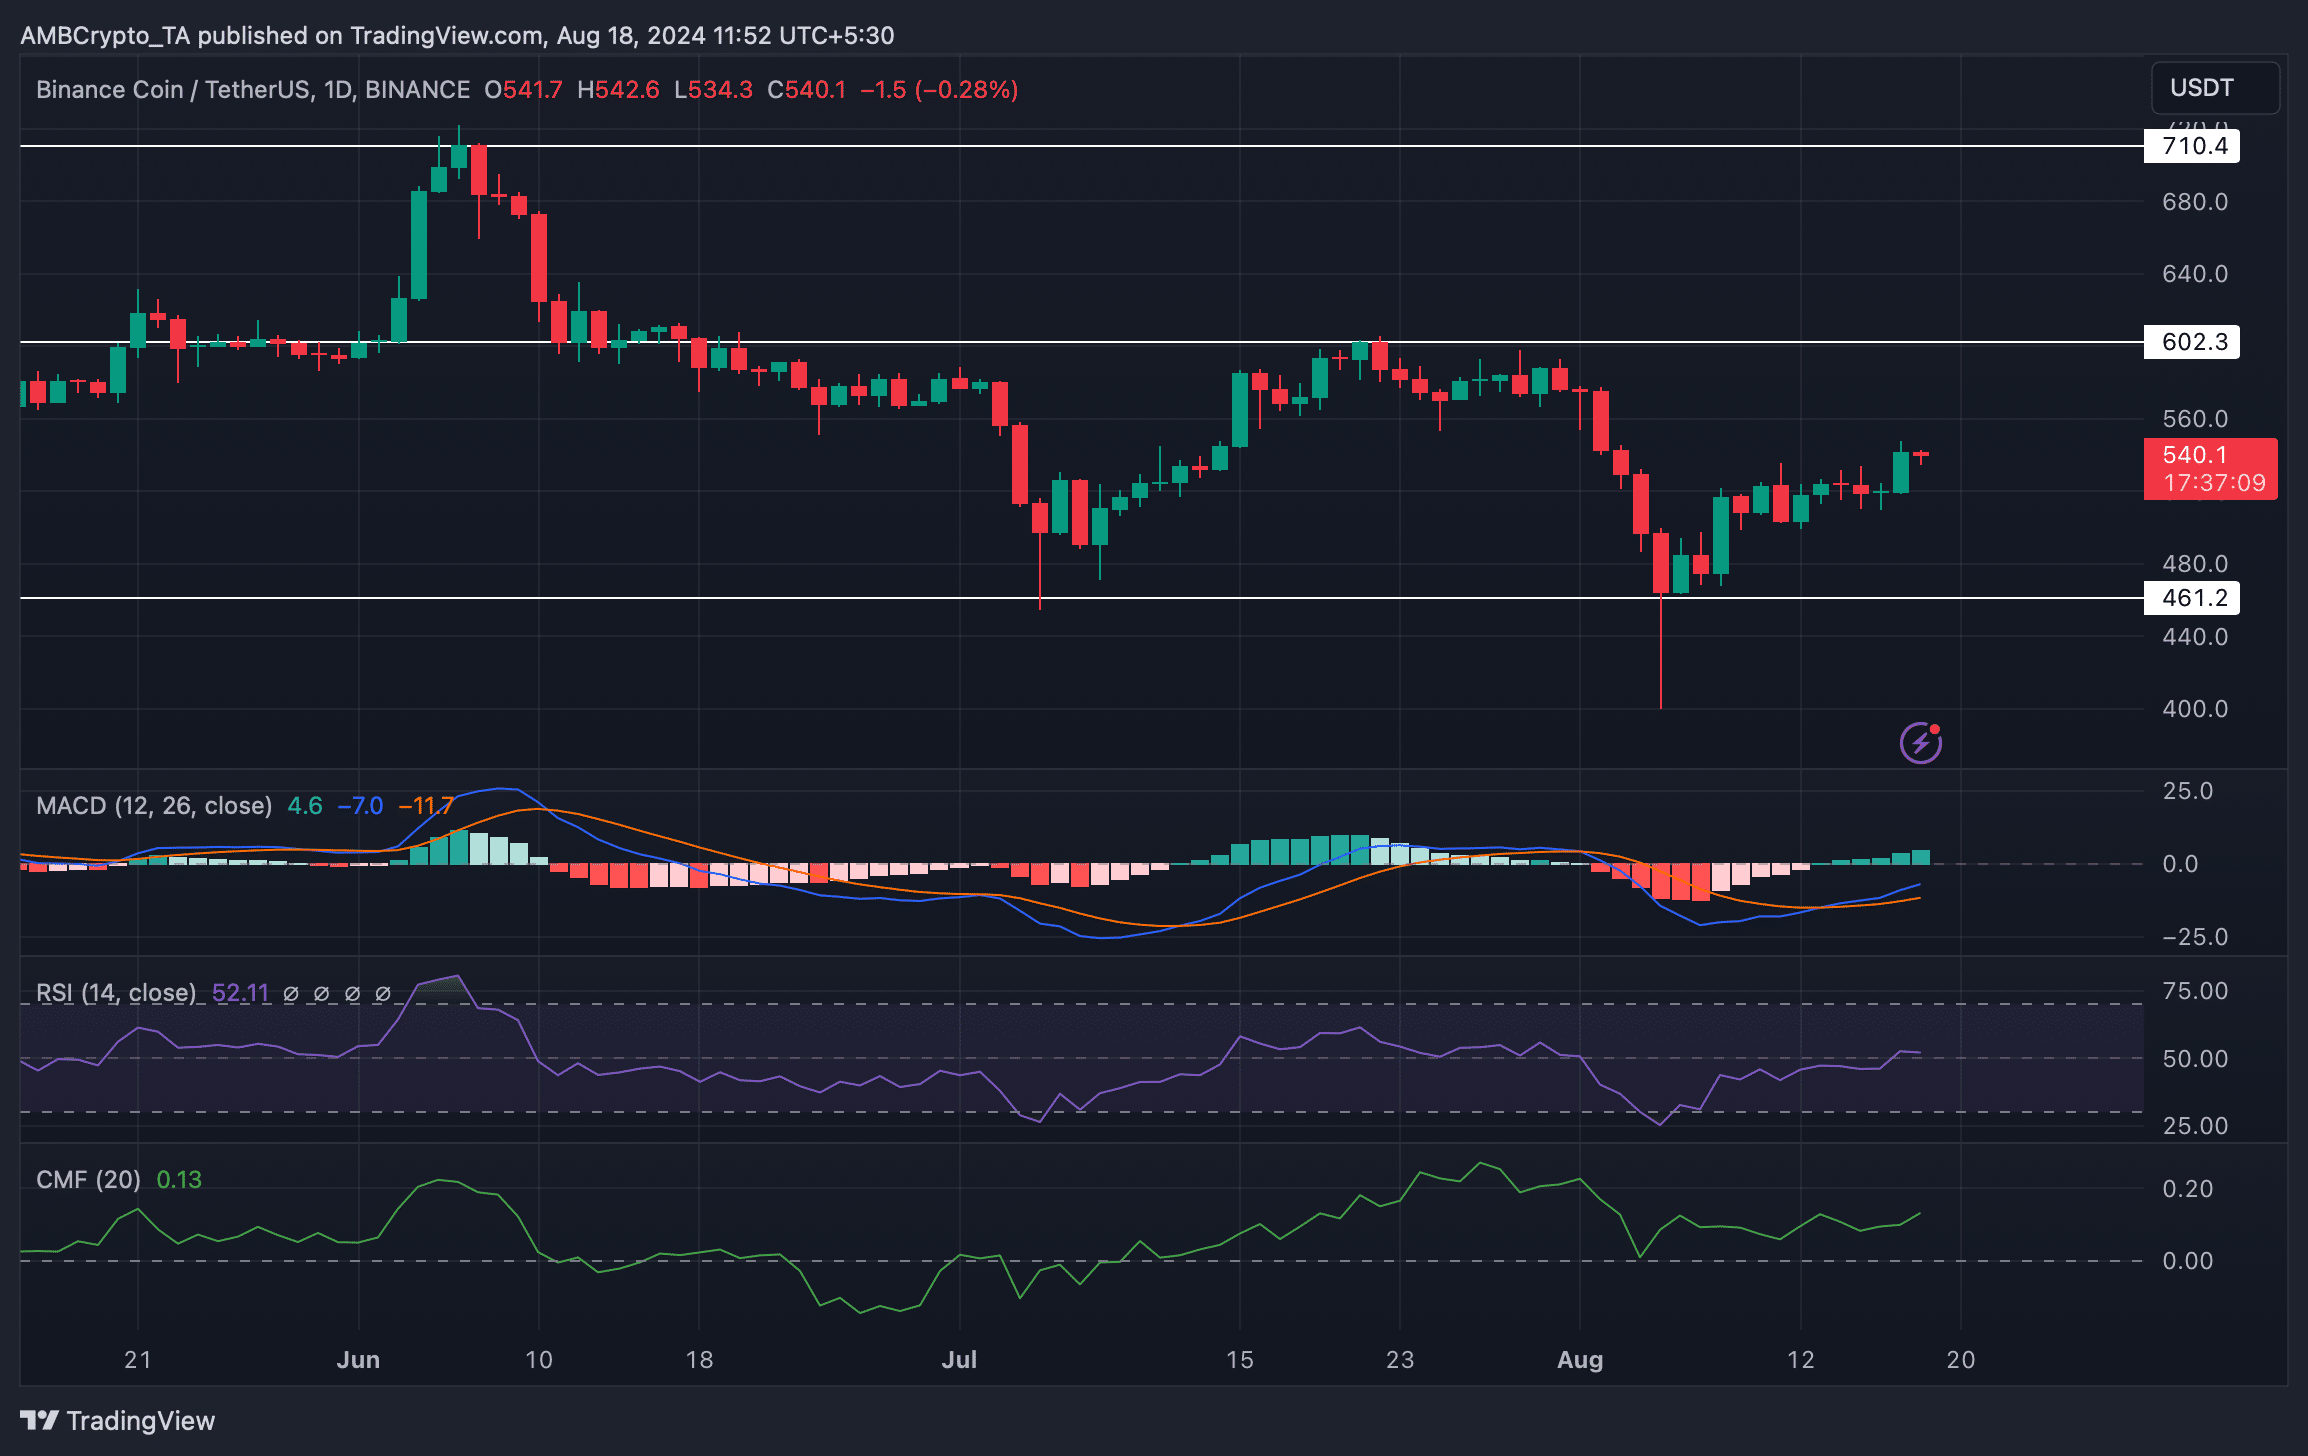
Source: TradingView