As Cosmos aims for the stars on price charts, buyer exhaustion may alter its path

Disclaimer: The findings of the following analysis are the sole opinions of the writer and should not be considered investment advice.
According to Coinglass data, the Long vs Shorts for Cosmos [ATOM] was skewed slightly in favor of the longs on popular exchanges such as Binance, FTX, and Okex over the past 24 hours. For the same time period, Bitcoin [BTC] was more neutral and Ethereum [ETH] saw a slight advantage to the short positions in terms of volume.
Their bullish bias over the previous day was justified as ATOM posted strong gains from the $14.6 area. Can this momentum continue over the weekend?
ATOM- 1-Hour Chart
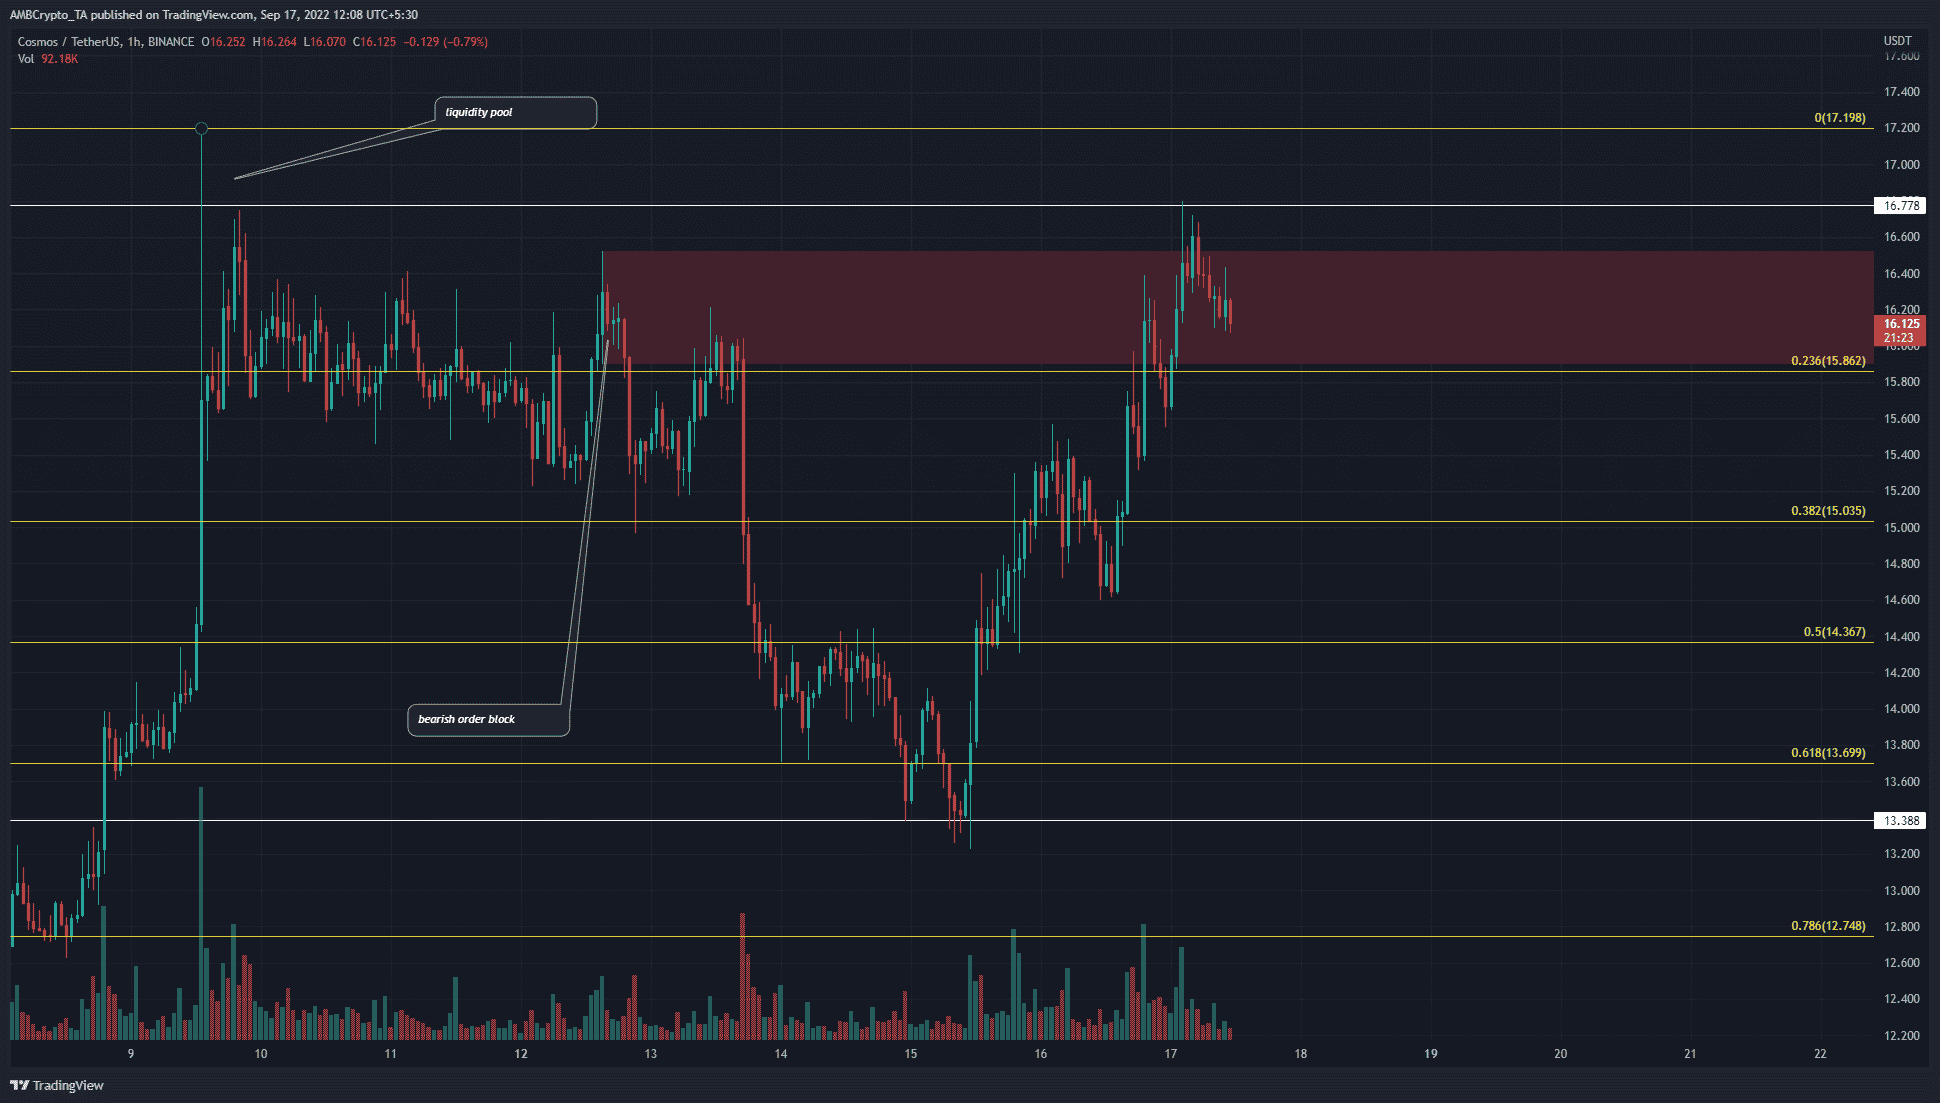
A little more than a week ago ATOM saw a strong move up from $12.8 to $17.19. On the way up, the bulls were actually rebuffed in their attempts to climb past $17. The long upper candle wick showed that a high amount of sell orders lay above $16.8.
In the days that followed, the price has stagnated just below the belt of resistance at $16.6 before taking a sharp turn to the south. The Fibonacci retracement levels (yellow) showed strong support at $13.7 and $14.36 for the native token of Cosmos.
Over the next day or two, a session close below $15.86 would indicate another rejection from the resistance zone at $16.4. On the other hand, a move above $16.8 and $17.2 could spell buying opportunities for shorter timeframe traders.
Rationale
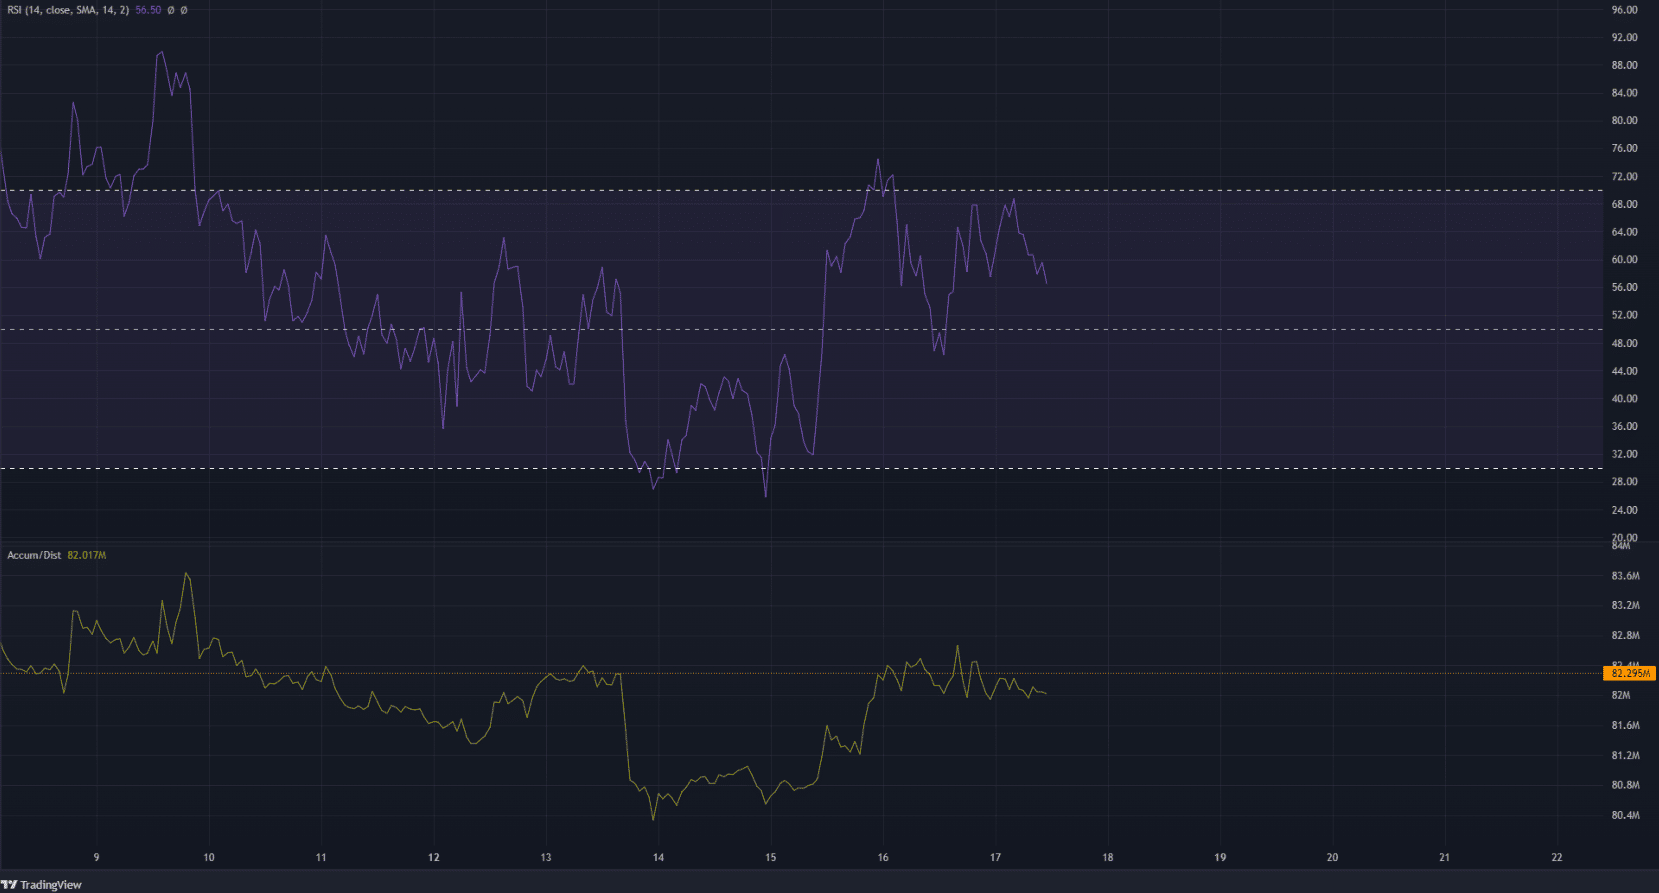
The Relative Strength Index (RSI) was in strongly bullish territory over the past few days. It stood at 56.5 on the hourly timeframe at the time of writing. It has stayed above neutral 50 line to show that the momentum has been northward recently. But based on the price action, this could take a bearish shift over the next few days.
Alongside the price, the Accumulation/Distribution (A/D) indicator also stood at a resistance zone. A breakout above the line (orange) marked on the indicator would show that buying pressure was on the rise. This could lead to a leg upward for Cosmos.
Conclusion
The indicators showed that bullish momentum was strong in the past couple of days. ATOM succeeded in reaching the $15.9-$16.6 resistance zone. At press time, a rejection looked likely for Cosmos. A breakout past $16.8 could flip the bias to bullish once more.