


Disclaimer: The information presented does not constitute financial, investment, trading, or other types of advice and is solely the writer’s opinion.
- ETC’s range highs were tested, but a breakout was not confirmed at press time.
- Market structure remained bullish.
Bitcoin [BTC] traded at $24.6k at the time of writing. It faced strong resistance at $25.2k. Both a breakout and consolidation under resistance for Bitcoin will probably present many altcoins with a bullish scenario. Ethereum Classic [ETC] is also one coin that could surge if sentiment stayed bullish.
Read Ethereum Classic’s [ETC] Price Prediction 2023-24
However, from a price perspective, it was possible that ETC would retrace a large portion of the gains it made over the past week. This was because the $24 area has posed stiff resistance over the past month.
The highs of a month-long range were tested once more
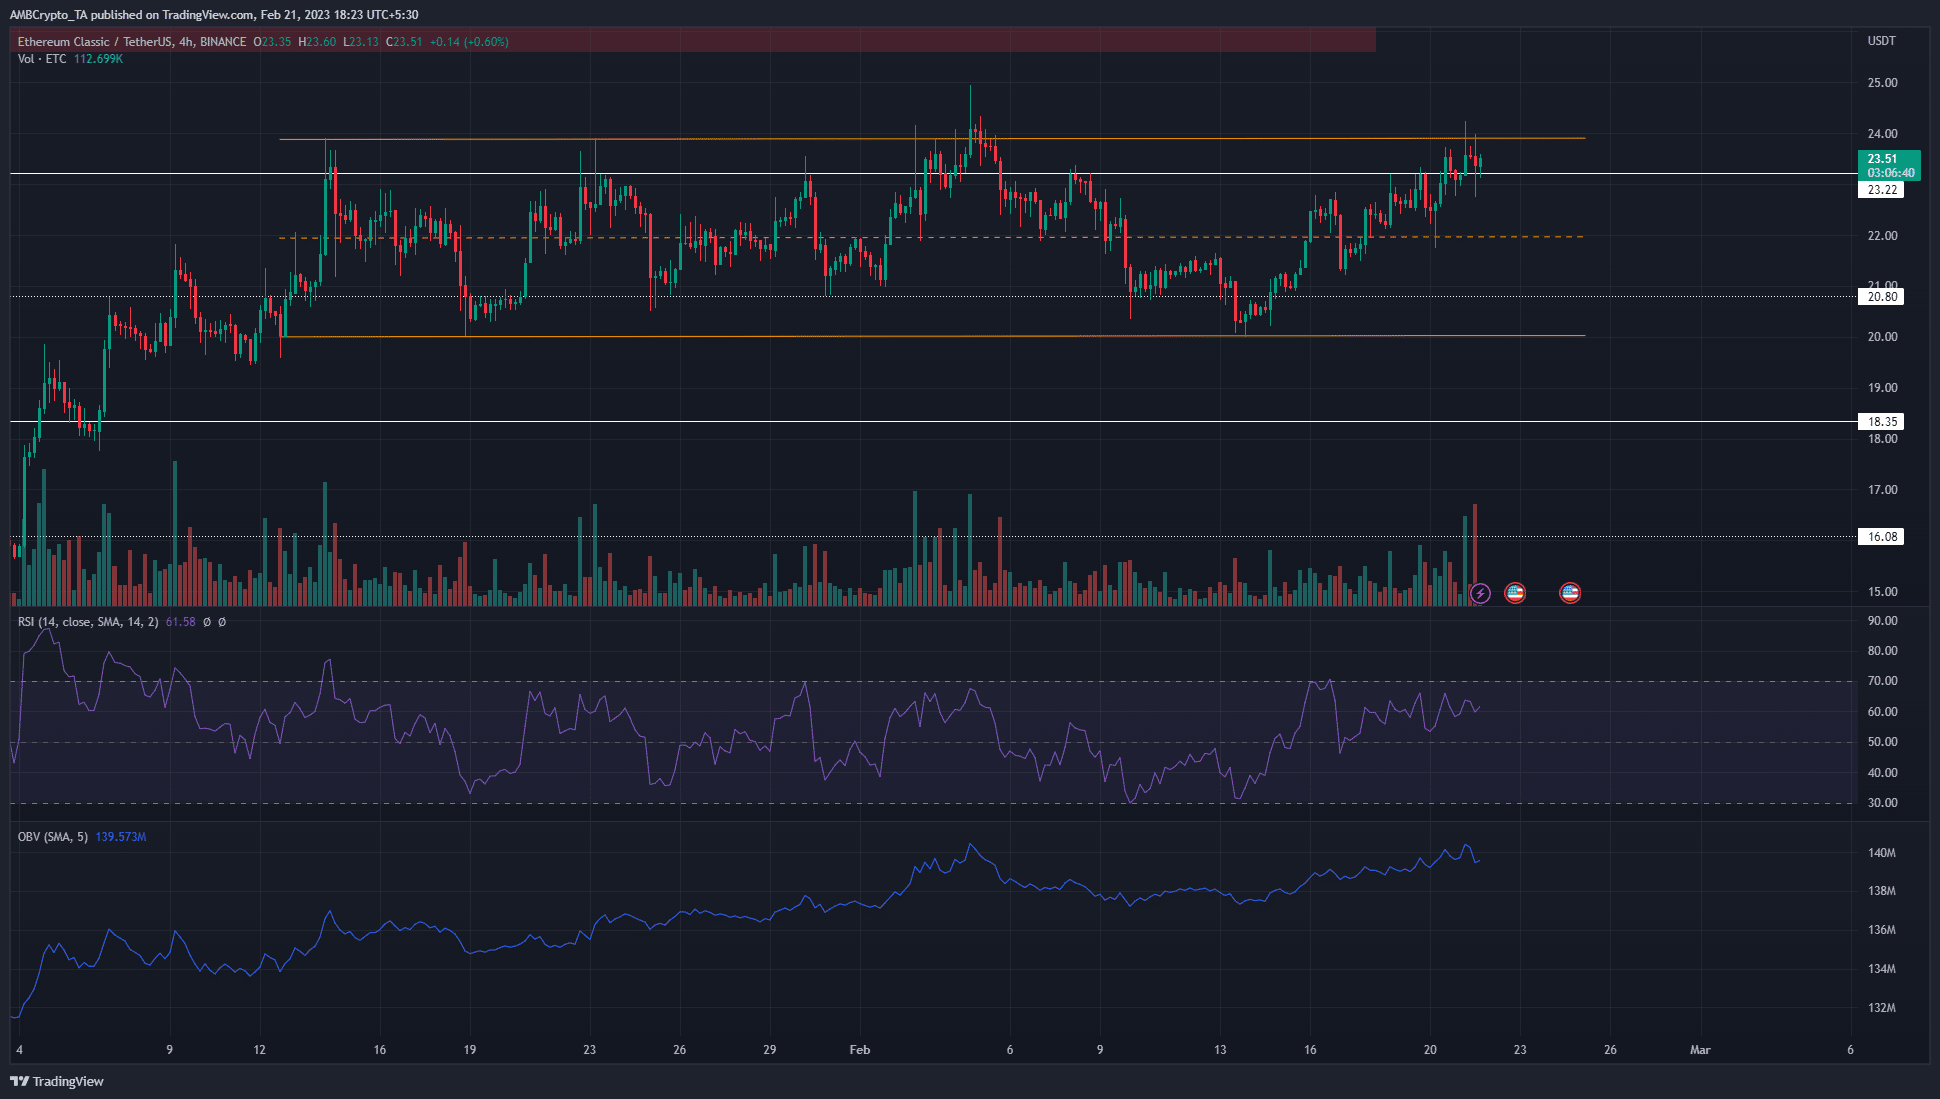
Since mid-January, Ethereum Classic has traded within a range between $20 – $24, with the mid-point at $22. The price has respected all three levels in recent weeks. At press time, ETC traded at $23.5, close to the range highs at $24.
The RSI was at 61 and has climbed higher over the past few days to show rising bullish momentum. The lower timeframes, such as one-hour, also showed a strong bullish market structure. Hence, momentum and structure continued to favor the buyers. The OBV was also on an uptrend, to show that buying pressure was steady and demand was present.
However, from a risk-to-reward point of view, it was not feasible to buy ETC at $23.5. An H4 market structure break would occur on a drop below $22, the mid-range mark. On the other hand, since $24 is a significant level of resistance, short sellers can wait for an opportunity.
Analysis of the one-hour and 30-minute timeframe charts showed that momentum was neutral. A move below $22.76 would break the market structure and flip it to bearish. Therefore, if ETC moved beneath $22.76 and then retested the $23-$24 area, short sellers can look to open positions targeting the $20 support. Their stop-loss can be set near $24.25.
On the other hand, a clean breakout past $24.5 and a retest of $24 as support can offer a buying opportunity.
Realistic or not, here’s ETC’s market cap in BTC’s terms
Open Interest showed bullish dominance has not waned
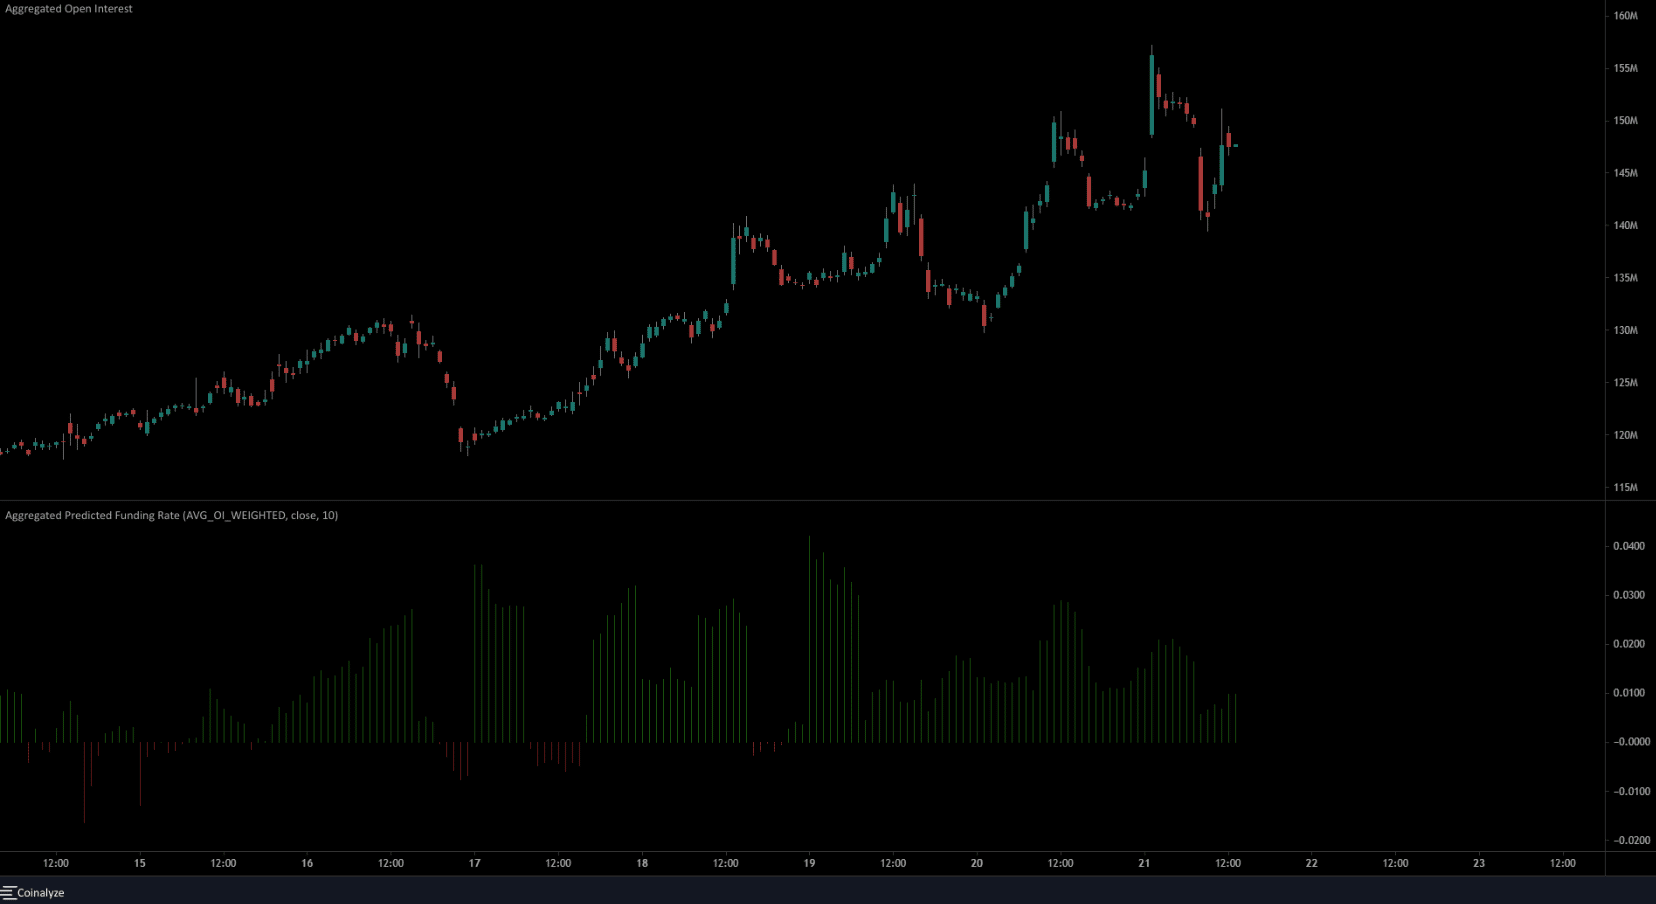
The one-hour chart showed rising Open Interest alongside the price. This was a strong indication of bullish sentiment in the futures market. Moreover, the funding rate was also positive. Hence, long positions were in the majority.
Taken together with the price movement, the conclusion was that further upside was likely. Yet, buyers must be prepared for a sharp downturn. If a move below $22.76 materializes, short sellers on lower timeframes can look to enter a trade.