


- JUP had a short-term downtrend in progress at press time.
- Long-term investors needed to wait for the formation of a range.
Jupiter [JUP] exhibited a steady downtrend in the days following its listing. The airdrop event garnered much excitement and showed a massive surge in activity on the Solana [SOL] network.
This downtrend could continue for a while longer.
While 440k addresses have already claimed their JUP, 54% of the eligible wallets have yet to claim their JUP. This leaves approximately 378 million JUP unclaimed.
The need for a range formation
JUP has been trading for less than a week at press time. Hence, AMBCrypto chose to look at the 2-hour price chart to understand its current trend.
The market structure was bearish due to the series of lower highs and lower lows in recent days.
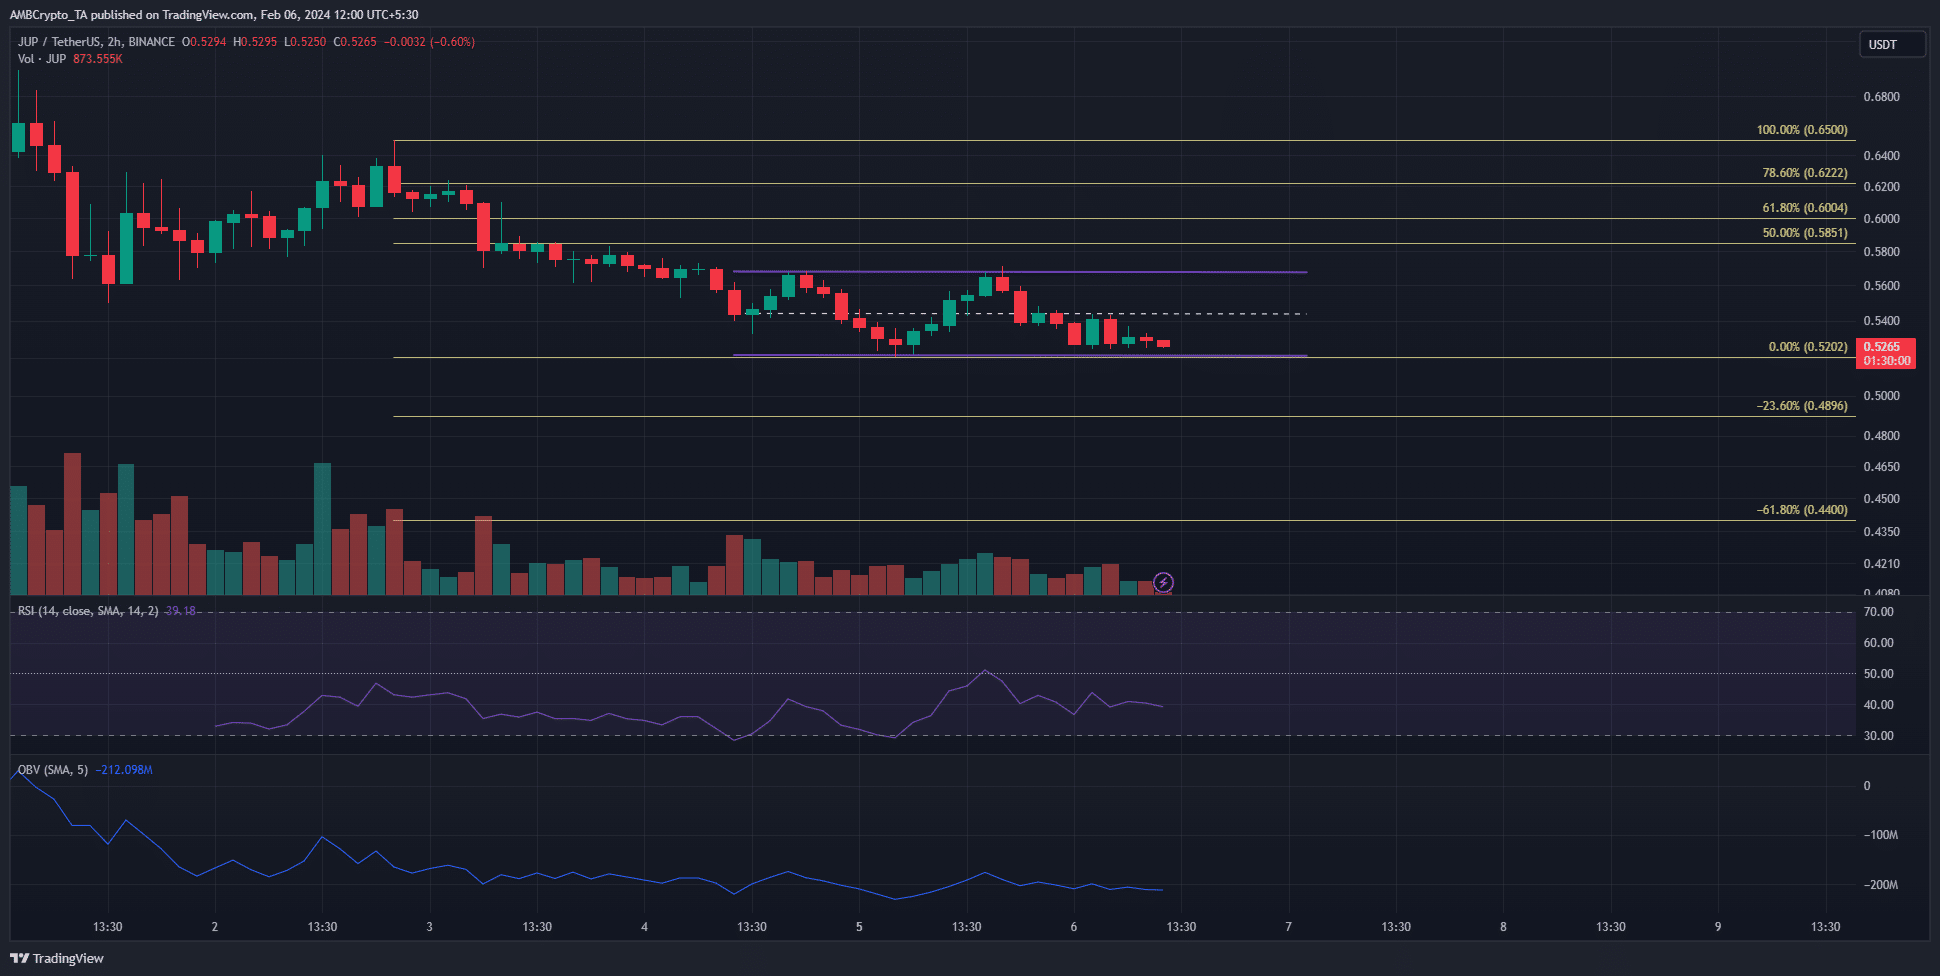
The drop below $0.55 was used to plot a set of Fibonacci extension levels. They showed that the 23.6% and 61.8% southward extension levels sat at the $0.489 and $0.44 levels.
Hence, these are possible support levels should prices drop further.
At press time, the token traded within a range (purple) that reached from $0.52 to $0.568. The mid-range mark at $0.544 has also served as both support and resistance.
If the token trades within this range, or another similar range below $0.5, for an extended amount of time (ideally multiple months), it would be seen as an accumulation phase.
The short-term sentiment also leaned bearishly

Analysis of the Coinalyze data showed a marginal increase in the Open Interest as JUP prices slid from $0.56 to $0.52. This pointed toward short sellers and bearish sentiment.
The spot CVD has also trended downward since the 3rd of February, highlighting a lack of buying pressure.
How much are 1, 10, or 100 JUP worth today?
The long-term range formation discussed earlier at $0.52 or lower than the $0.5 mark would be a sign of consolidation.
Thereafter, each retest of the lows would provide investors with an ideal buying opportunity. A breakout would likely lead to a strong rally, provided it is backed by demand in the spot markets.
Disclaimer: The information presented does not constitute financial, investment, trading, or other types of advice and is solely the writer’s opinion.