- Pepe has a bearish structure and outlook on the higher timeframes.
- Another 5% move higher is expected, but demand was too weak to indicate any further gains.
Pepe [PEPE] saw outflows from exchanges and some evidence of accumulation in recent weeks. At the same time, holders were at a loss, and consistent selling pressure has forced this year’s downtrend.
This long-term bearishness has not yet ended.
In the short term, there was some hope for small gains. A move to the two-week range highs was expected, but a breakout was not. Here are the levels traders need to watch out for.
Pepe rebounds from mid-range support
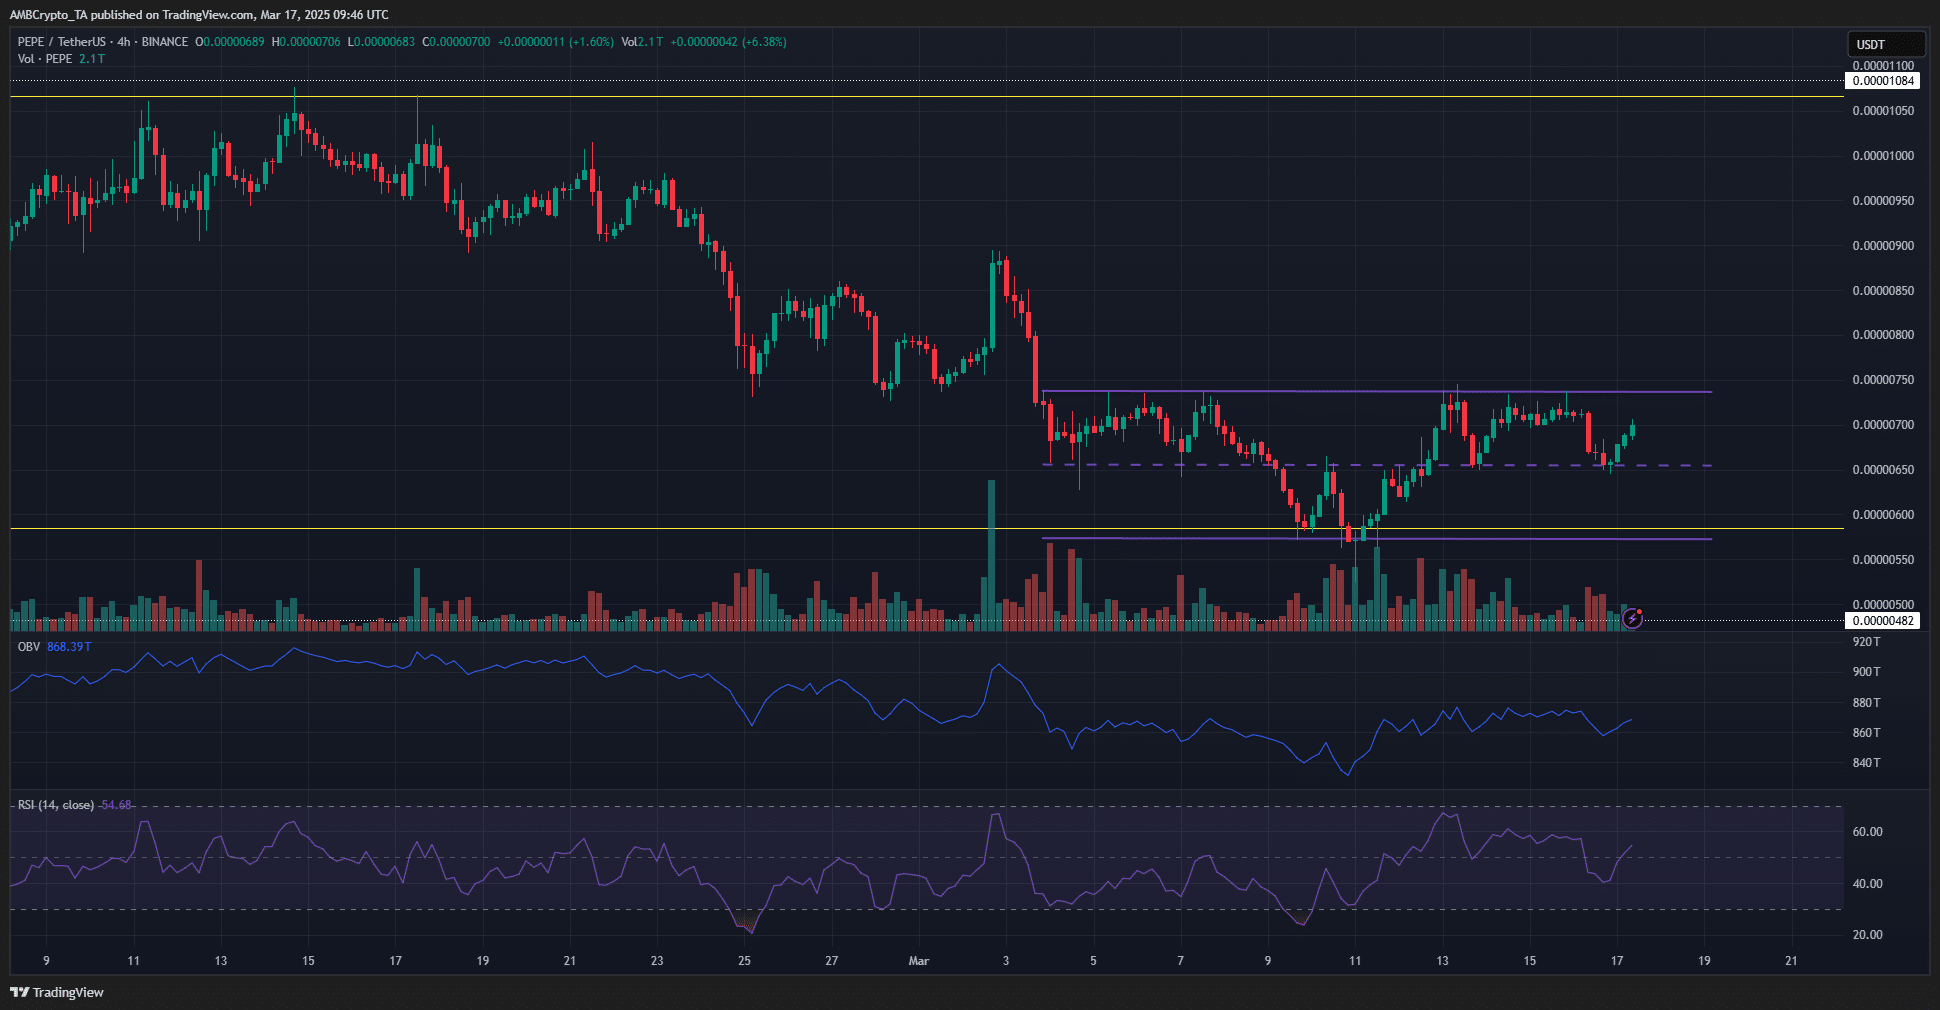
Source: PEPE/USDT on TradingView
The higher timeframes were firmly bearish, but the lower timeframes showed consolidation for the memecoin. PEPE has traded between the $0.00000572 and $0.0000736 levels for two weeks now.
The range formation (purple) had validity because not only were the extremes respected, but also the mid-range level at $0.00000655.
The repeated tests of this level as support and Pepe’s strong response increased the range’s credibility.
At press time, the RSI was climbing back above neutral 50 after a dip over the weekend. This showed short-term bullish momentum that could take PEPE to the range highs.
A breakout was not on the cards, but traders should still manage risk in case one occurs.

Source: Coinglass
The 1-month liquidation heatmap showed a cluster of liquidity at $0.0000075, just above the range highs.
This backed up the idea that Pepe prices would jump another 5% in the coming hours or days to sweep the liquidity pocket. Further higher, the $0.000009 was the next magnetic zone to watch.
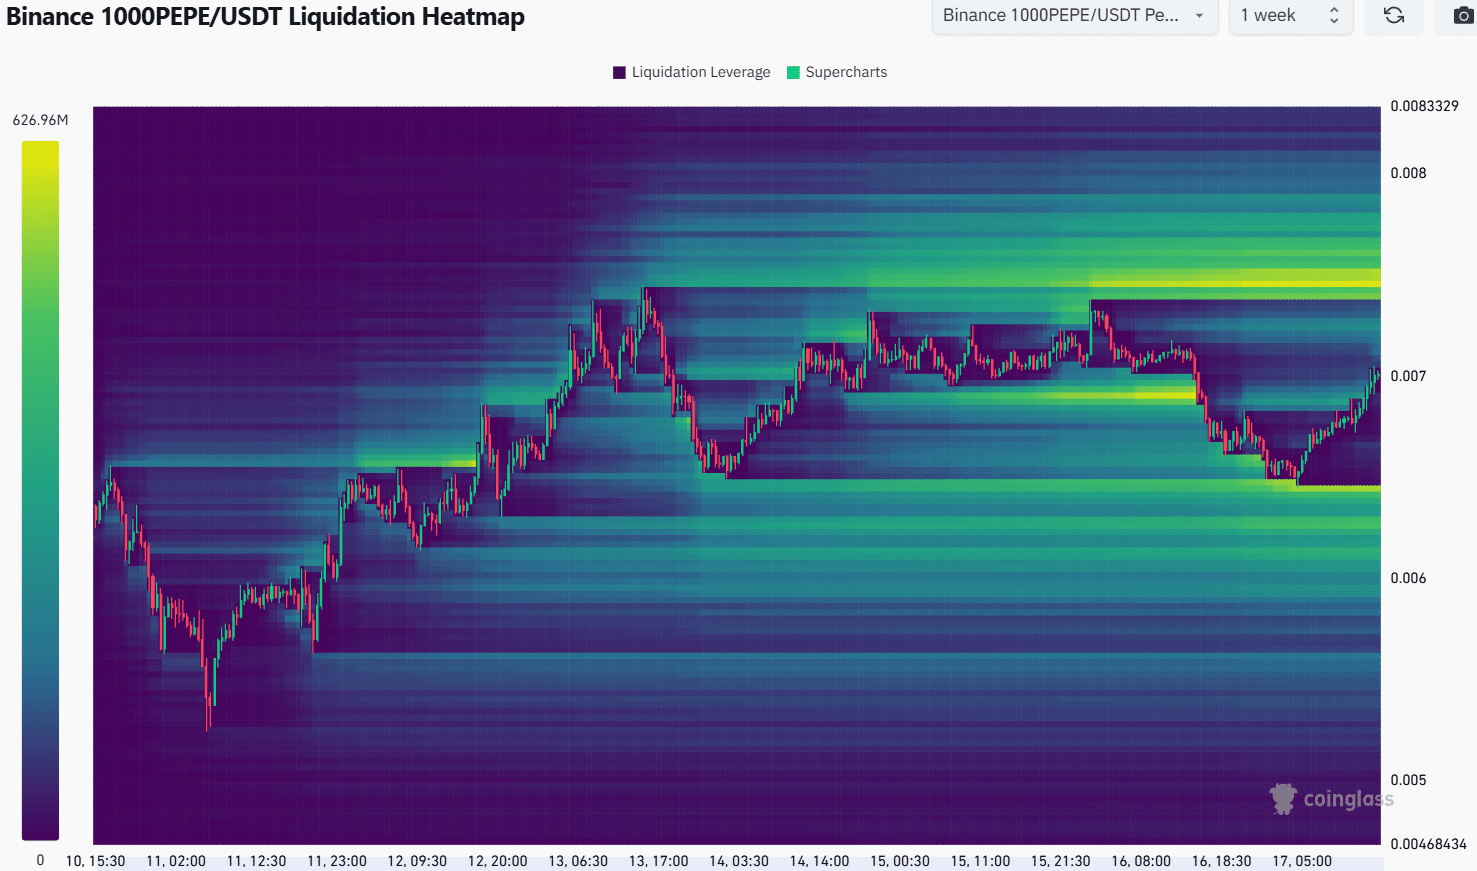
Source: Coinglass
Since the volume indicator does not show a breakout was likely, we can stick to the idea that the range formation would persist. The 1-week heatmap showed a liquidity pocket at $0.00000745-$0.0000075.
The local low around $0.00000645 was a short-term bearish target. This level was just below the mid-range level, meaning that a retest of the mid-range region could offer swing traders a buying opportunity.
Bitcoin [BTC] volatility could ruin the Pepe range formation and cause deviations above the range during the New York session for traditional markets.
Disclaimer: The information presented does not constitute financial, investment, trading, or other types of advice and is solely the writer’s opinion