As Uniswap [UNI] hits key supply level, here’s where bulls can bid …
Uniswap [UNI] has been bullish for seven days. But it faced a double blockage that may tap sellers to gain market entry, especially if BTC fails to go beyond $31k.

Disclaimer: The information presented does not constitute financial, investment, trading, or other types of advice and is solely the writer’s opinion
- UNI was bullish on the 12-hour chart
- Trading volumes declined; short-term selling pressure increased
On 13 April, Uniswap [UNI] flipped its structure to bullish but faced downward pressure near the $6.5 – $6.6 range resistance. At press time, UNI surged and traded at $6.3, after Bitcoin [BTC] reclaimed the $30k price range.
But the rally faced a double blockage of 200-MA (Moving Average) and the range resistance, which could set it for a quick pullback.
Read Uniswap’s [UNI] Price Prediction 2023-24
More rally or dump – which way for UNI?
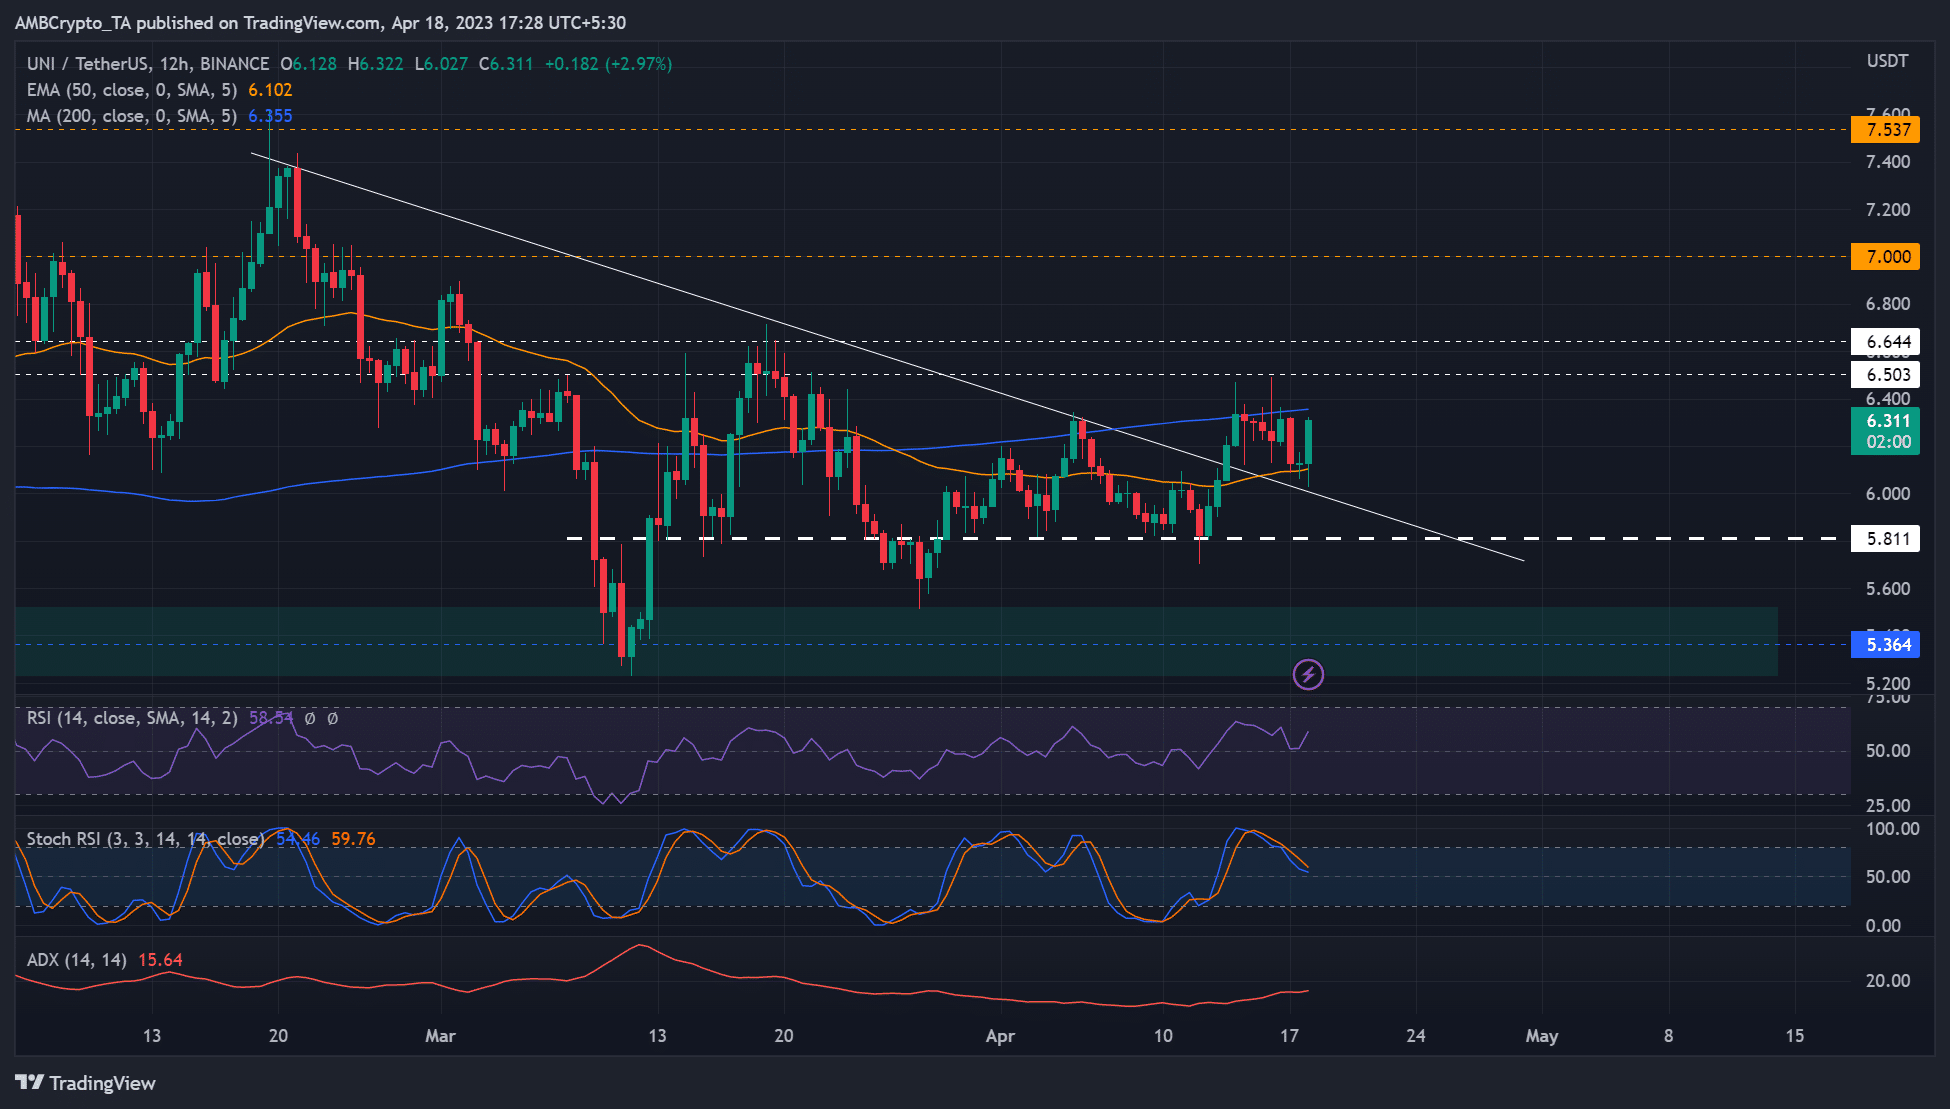
After the breakout above the multi-week descending trendline, UNI faced two price rejections at the $6.5 – $6.6 range resistance. For the past few days, the candlesticks closed below the 200-MA, making it a key dynamic resistance level too. As such, the price action faced double blockage that could tip sellers to gain market entry.
Shorting at the current level could offer a good risk ratio if the pullback drops to the descending trendline level of $6.0. However, the 50-EMA level of $6.102 could also slow the dump. Therefore, another price rejection at $6.5 – $6.6, especially if BTC fails to surge beyond $30.4k, could offer a good shorting opportunity.
A close above $6.6 will invalidate the above bearish thesis. A bullish BTC could accelerate such an upswing, setting UNI bulls to target the $7 psychological level. The next resistance level lay at $7.5.
Meanwhile, the Relative Strength Index (RSI) registered an uptick, indicating increased buying pressure. On the other hand, the stochastic RSI retreated but almost hit the neutral level. It suggested the bulls had the upper hand, but selling pressure wasn’t far away.
Nevertheless, the Average Directional Index (ADX) increased, indicating the recent rally hasn’t waned off.
Trading volume declined; sell pressure increased
Is your portfolio green? Check UNI Profit Calculator
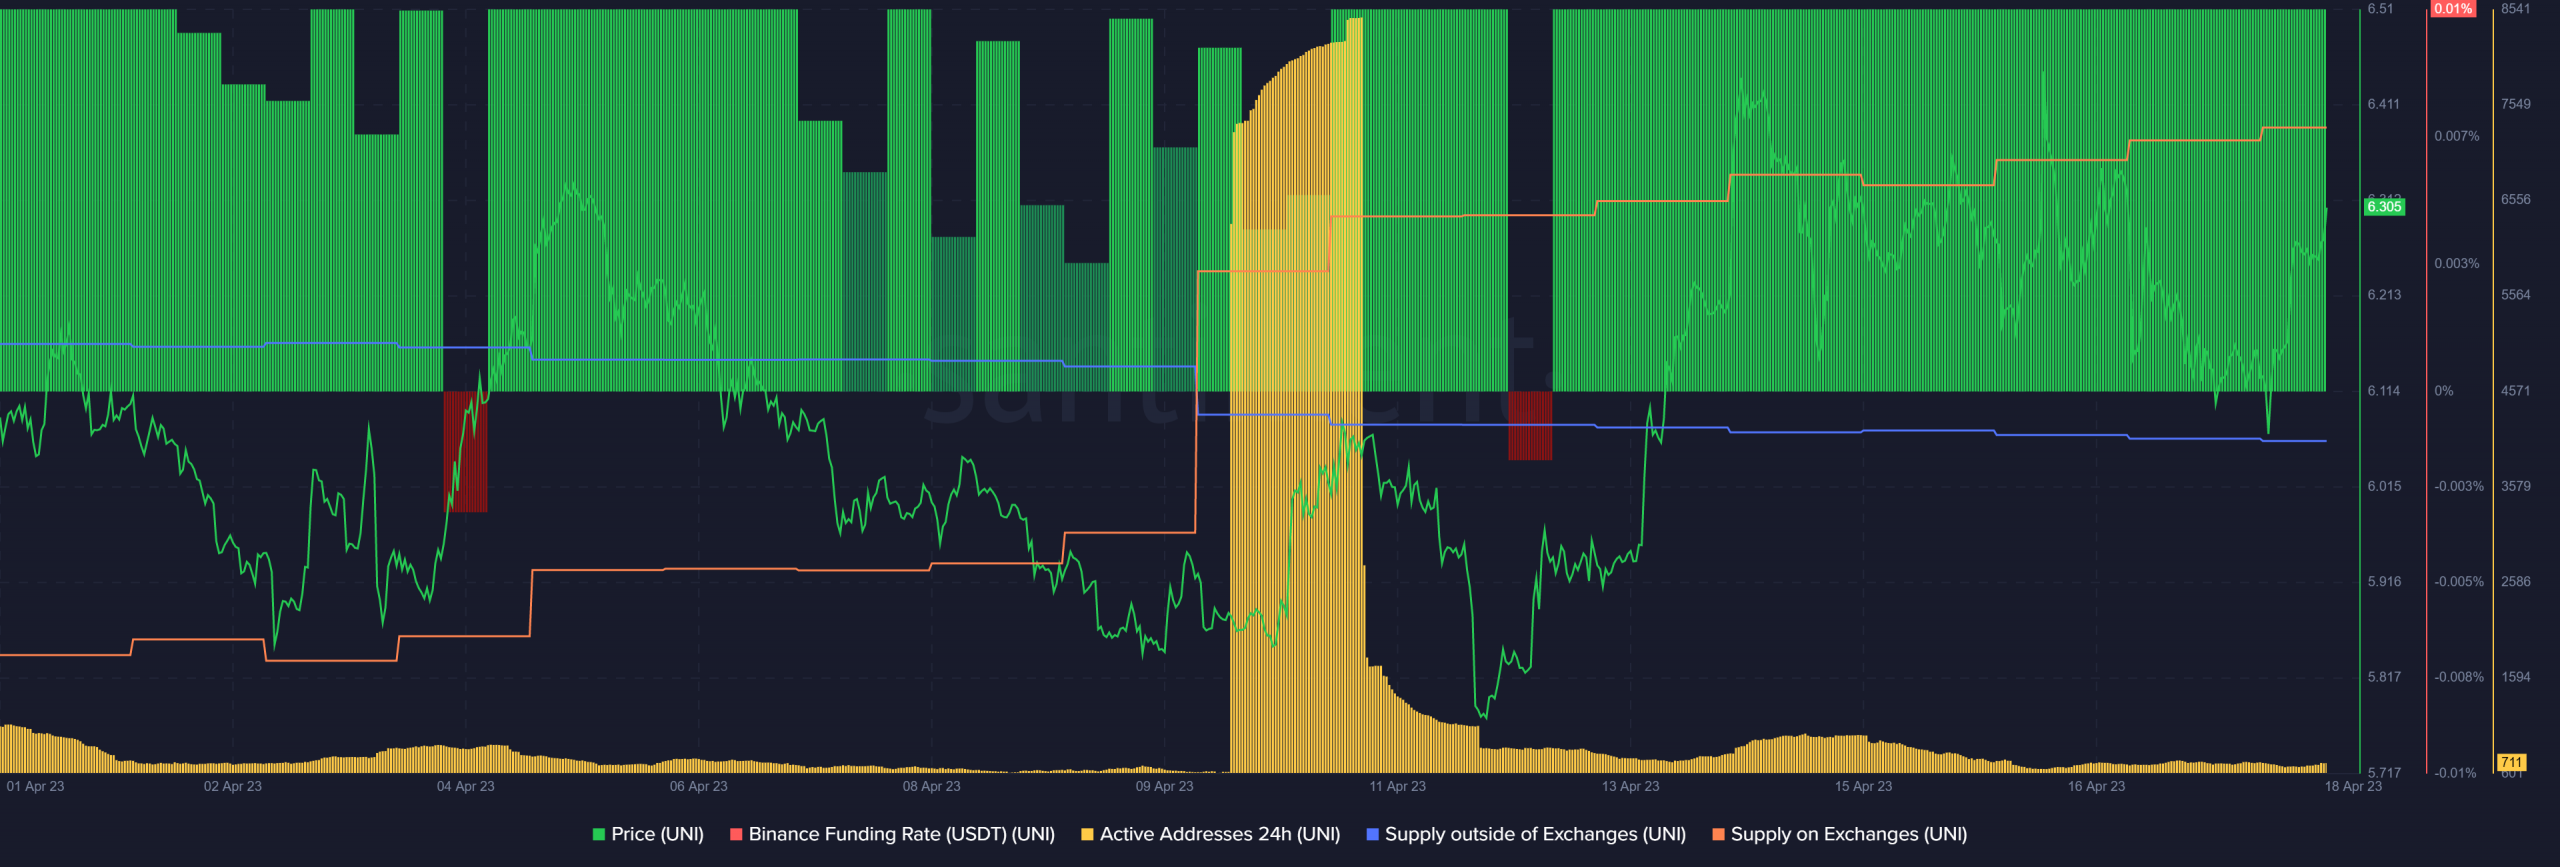
UNI’s trading volumes peaked around 9 – 10 April, as shown by the active addresses (yellow bars). Post which, the active addresses declined, undermining trading volumes and could expose UNI to elevated selling pressure.
Interestingly, there was an uptick in supply on exchanges at press time – evidence of short-term selling pressure. On the other hand, supply outside of exchanges, which indicates short-term accumulation, dipped lower, reiterating the increasing short-term sell pressure.