
- SingularityNET, Fetch.ai,and Ocean Protocol native tokens merged to create the ASI cryptocurrency in July.
- ASI price has established a firm footing above the $0.76 level, which coincides with its most recent breakout zone.
Artificial Superintelligence Alliance [ASI], the token from the merger between Fetch.ai, SingularityNET, and Ocean Protocol, has struggled to meet traders’ expectations in the last six weeks.
The AI-themed alliance token posted ten consecutive red daily candles between 27th July and 5th August, dropping from $1.32 to $0.72.
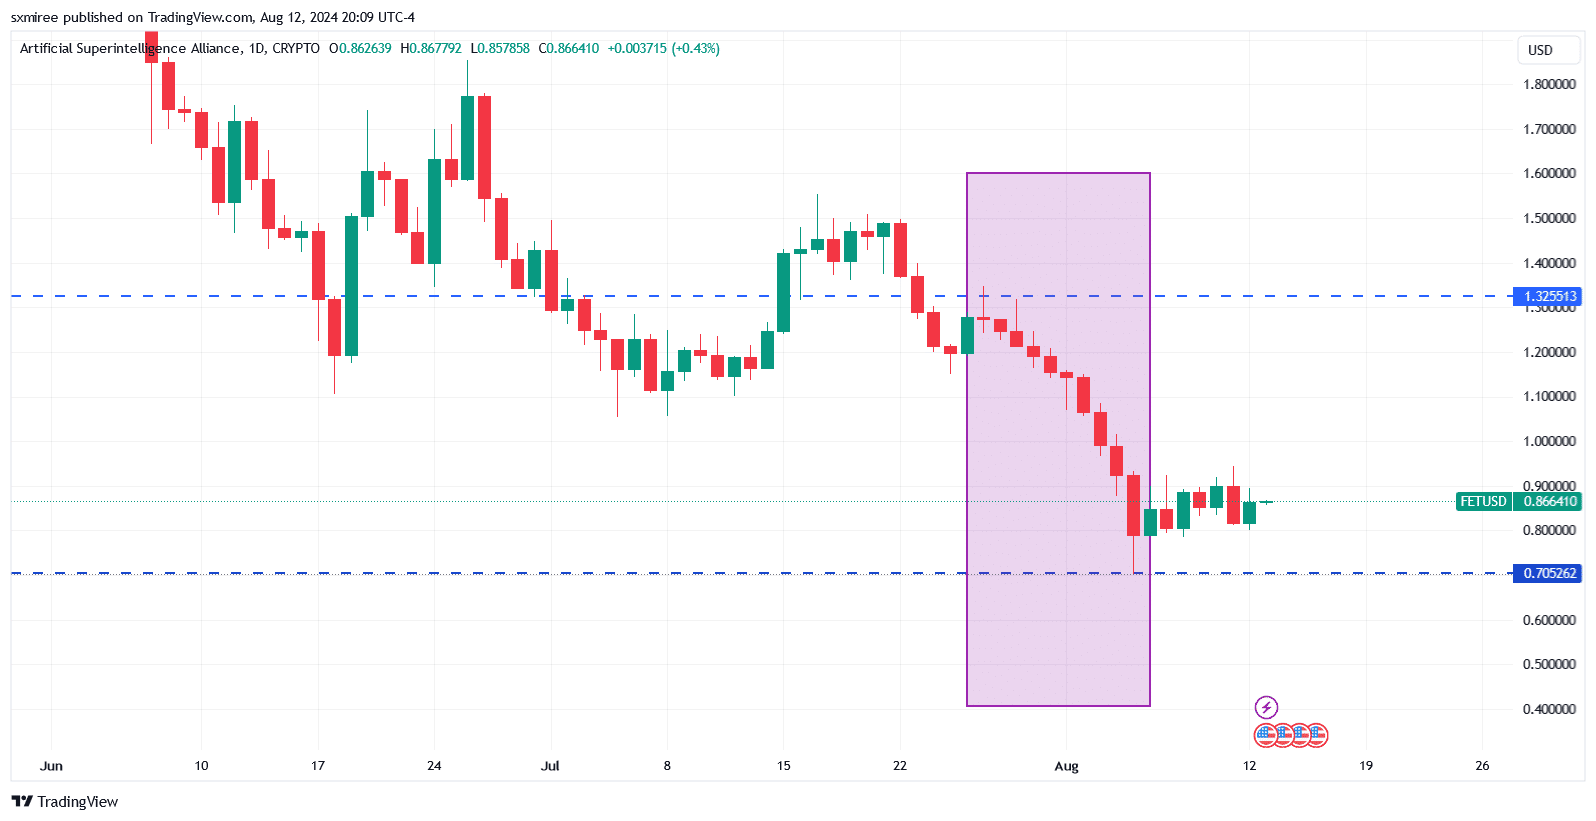
Source: TradingView
Notably, the 24-hour trading volume rose during this period of aggressive selling, exceeding $321 million at the height of the losses on 5th August.
ASI was changing hands at $0.8475 at press time, down 27% in the last 30 days and 75% below its March all-time high.
CoinMarketCap data also showed that ASI has shed more than 40% since the migration of SingularityNet and Ocean Protocol native tokens to the new collective cryptocurrency started on 1st July.
SingularityNET AGI supercomputer
Last week, SingularityNET announced that its new AGI supercomputer is expected to come online in September. The announcement specified a timeline of “end of 2024 or early 2025” for the completion of the development of the first computing machine.
The exact date will, however, depend on supplier delivery timelines. The supercomputing network being developed by the decentralized AI marketplace will use a tokenized system to grant and manage user access.
ASI/USDT technical analysis
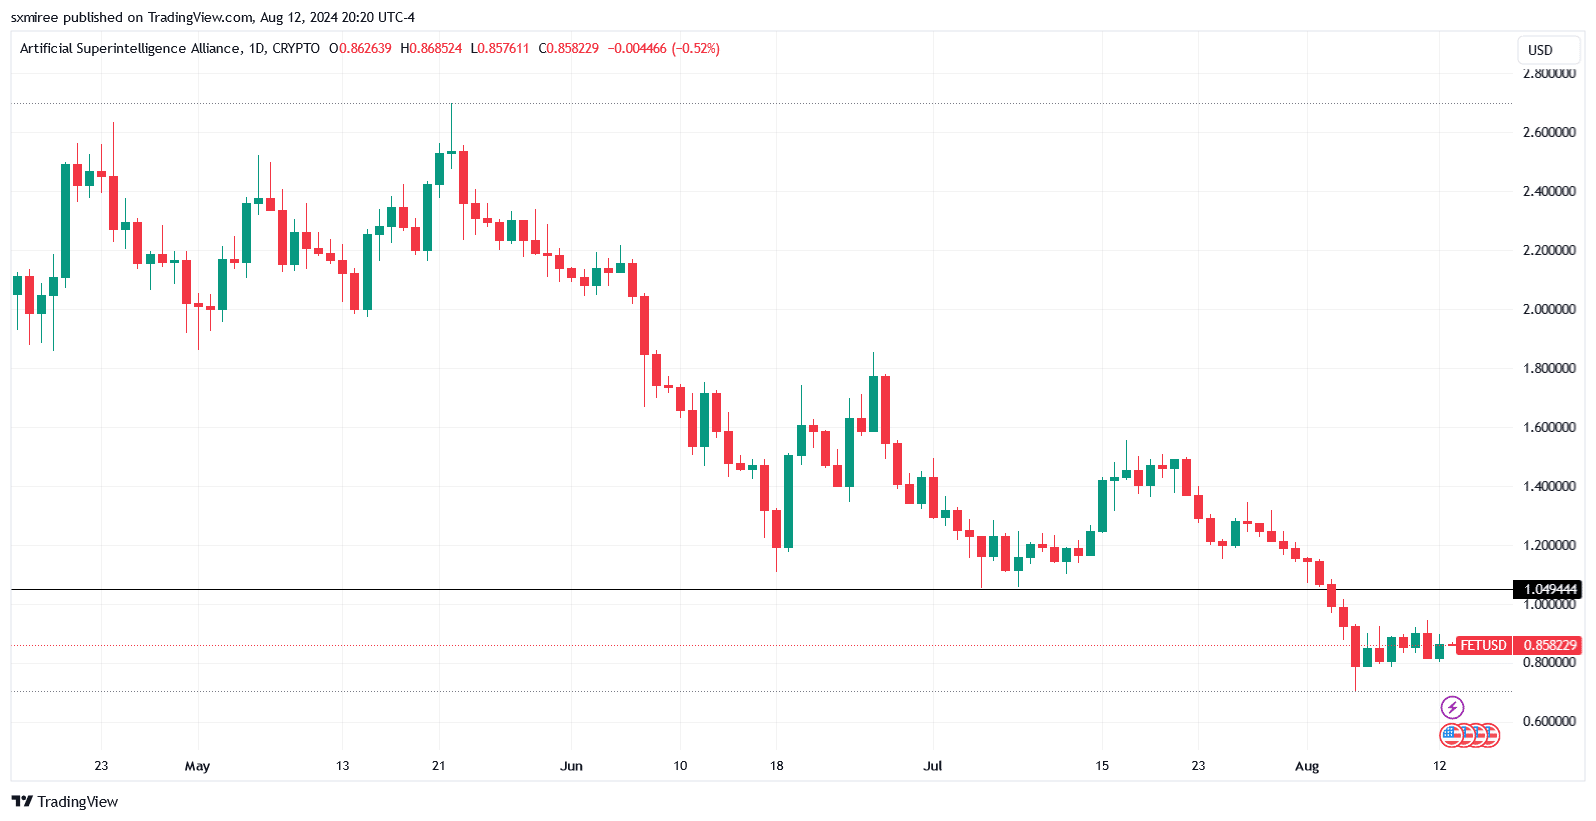
ASI token has been facing a strong downturn since May when it traded under the FET symbol.
For over a month after phase one of the merger began on 1st July, the AI-themed token traded consistently above $1.04. It fell below the threshold for the first time on 4th August, owing to the crypto and stock market sell-off.
Source: TradingView
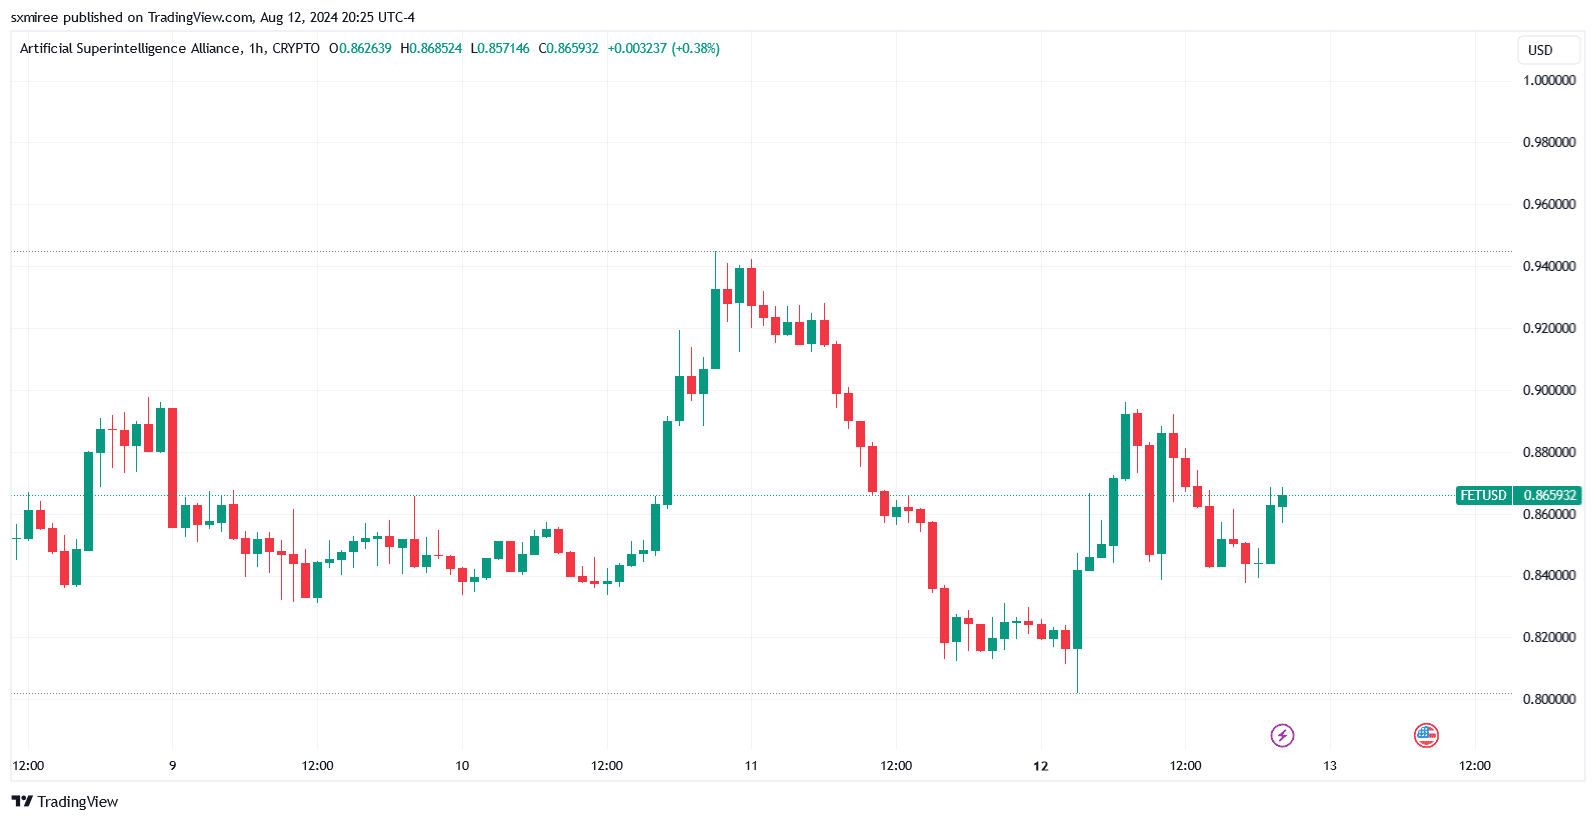
ASI price attempted to close in on the $1 mark over the weekend, trading as high as $0.94 on Sunday, 11th August, but ultimately gave up the gains.
The token retreated to $0.80 ahead of the new week before recovering and attempting another climb above $0.90, which was similarly rejected on Monday.
Source: TradingView
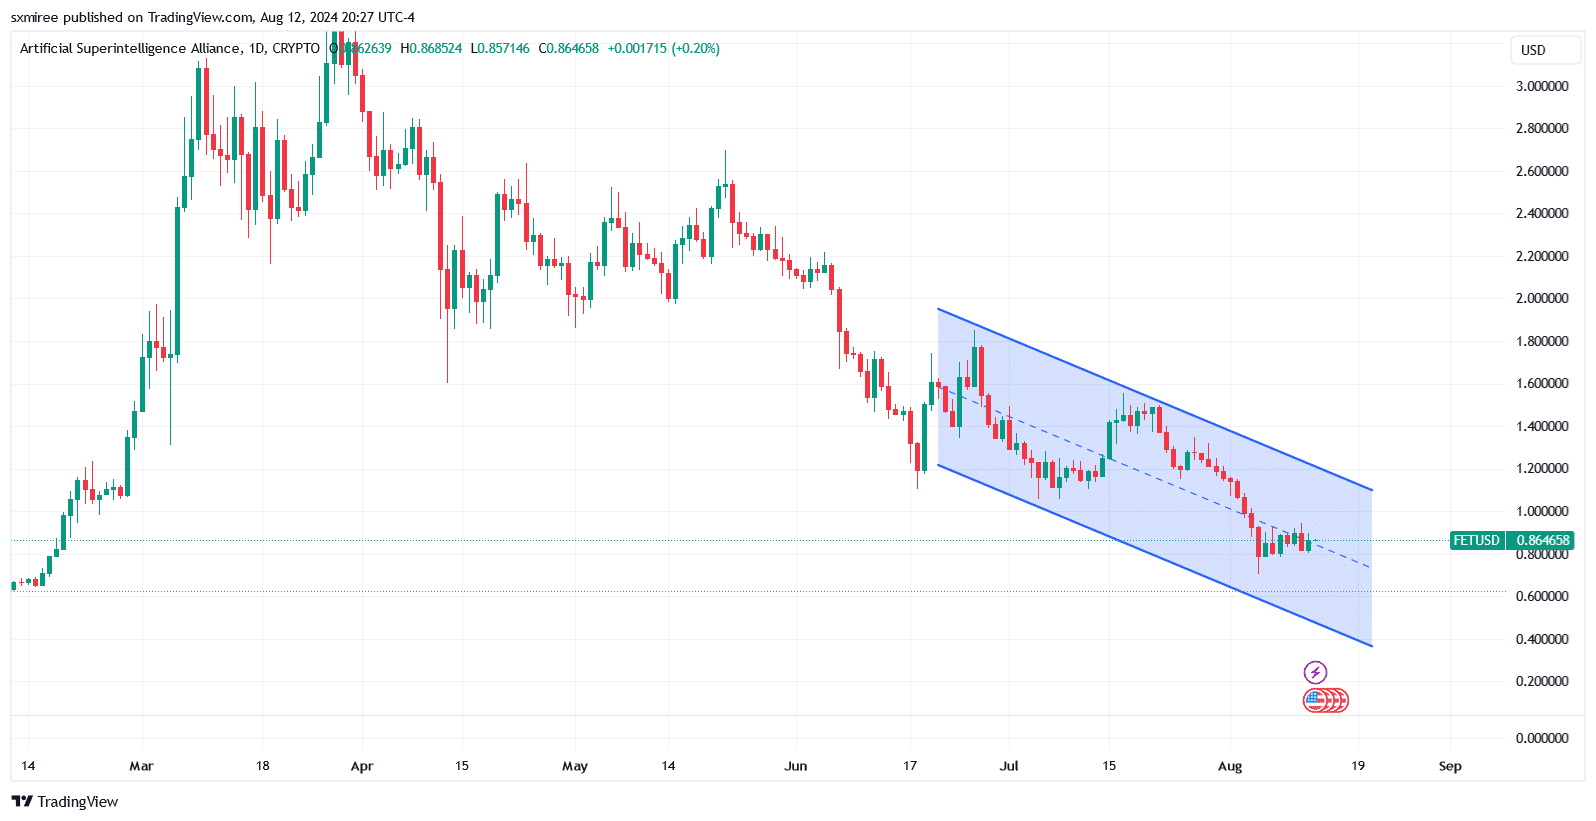
The ASI/USDT daily chart shows the pair is trading inside a bearish descending channel with an upper boundary near the $1.6 mark. Price action within a declining parallel channel usually signifies continued downward pressure.
Source: TradingView
That said, a breakout above the upper boundary of the channel could suggest a potential trend reversal and buying opportunity.
Meanwhile, lagging indicators show that ASI currently hovers below the 20-, 50-, and 100-day exponential moving averages (EMA), indicating weakness.
The 100-day EMA crossed below the 200-day EMA on the daily chart on 9th August, signaling that the market could experience further declines.
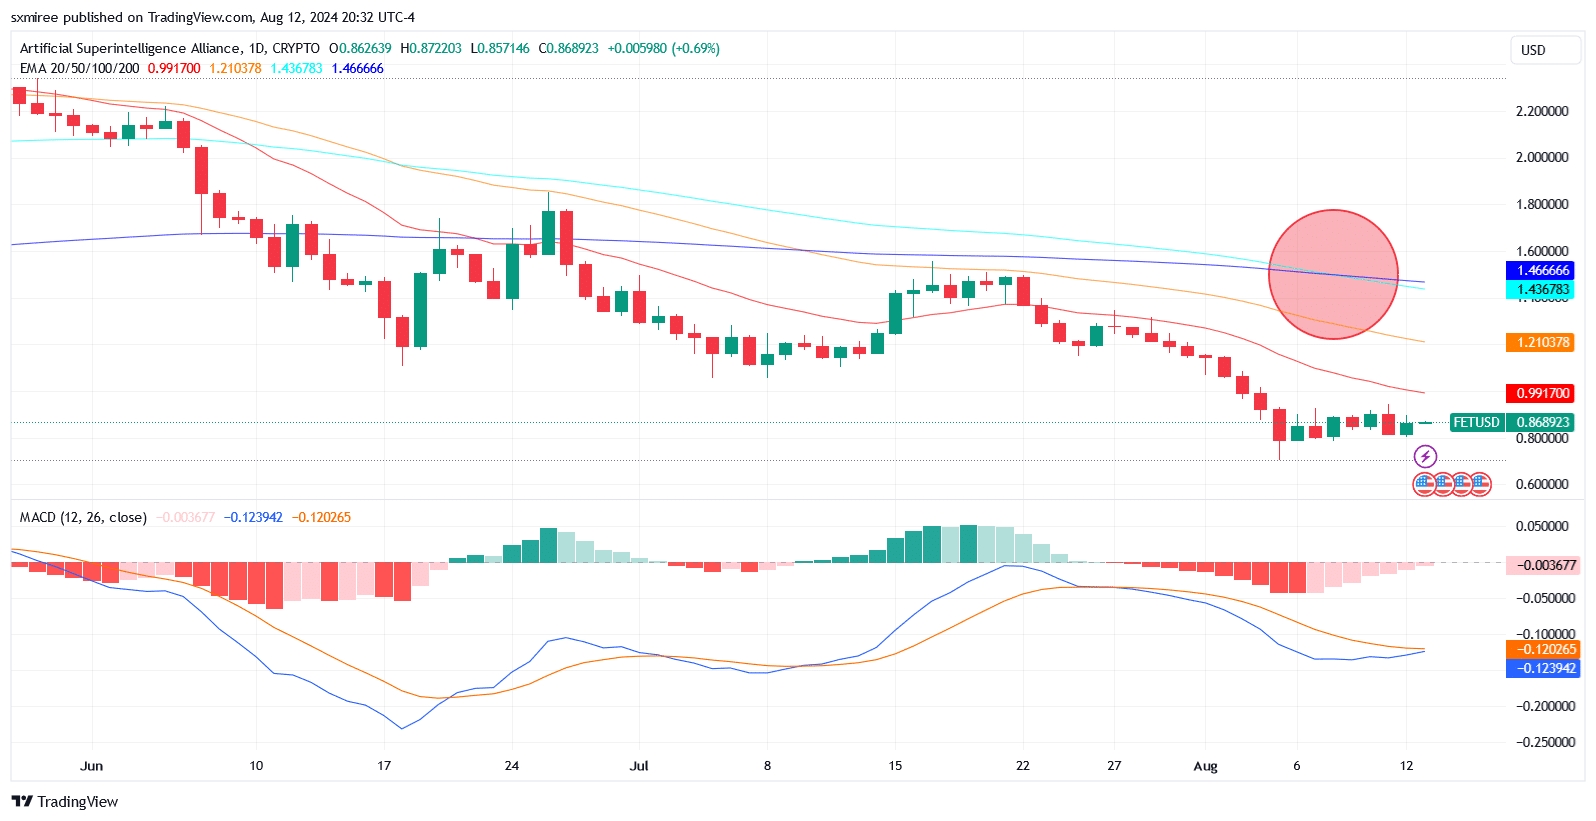
Source: TradingView
Consecutive negative Moving Average Convergence/Divergence (MACD) readings in the last week confirm weakening demand as sellers dominate the market.
The signal line trending above the MACD line further suggests that bearish momentum is strong and indicates the likelihood of an extended price downtrend.