
Bitcoin – Why BTC’s $156K–$168K year-end target looks likely

Disclaimer: The findings of the following analysis are the sole opinions of the writer and should not be taken as investment advice
Isolating Bitcoin’s movement since 7 September’s sell-off presented a rather worrying picture. Two lower highs have been followed by lower lows as BTC slipped below its 50% and 38.2% Fibonacci levels. This opened the door for a further retracement towards the 23.6% Fib level, one which would allow for a revisit to lows seen in June and July.
At the time of writing, Bitcoin was trading at $41,188, down by 4% over the last 24 hours, after the PBoC’s latest diktat on crypto-trading.
Bitcoin Daily Chart
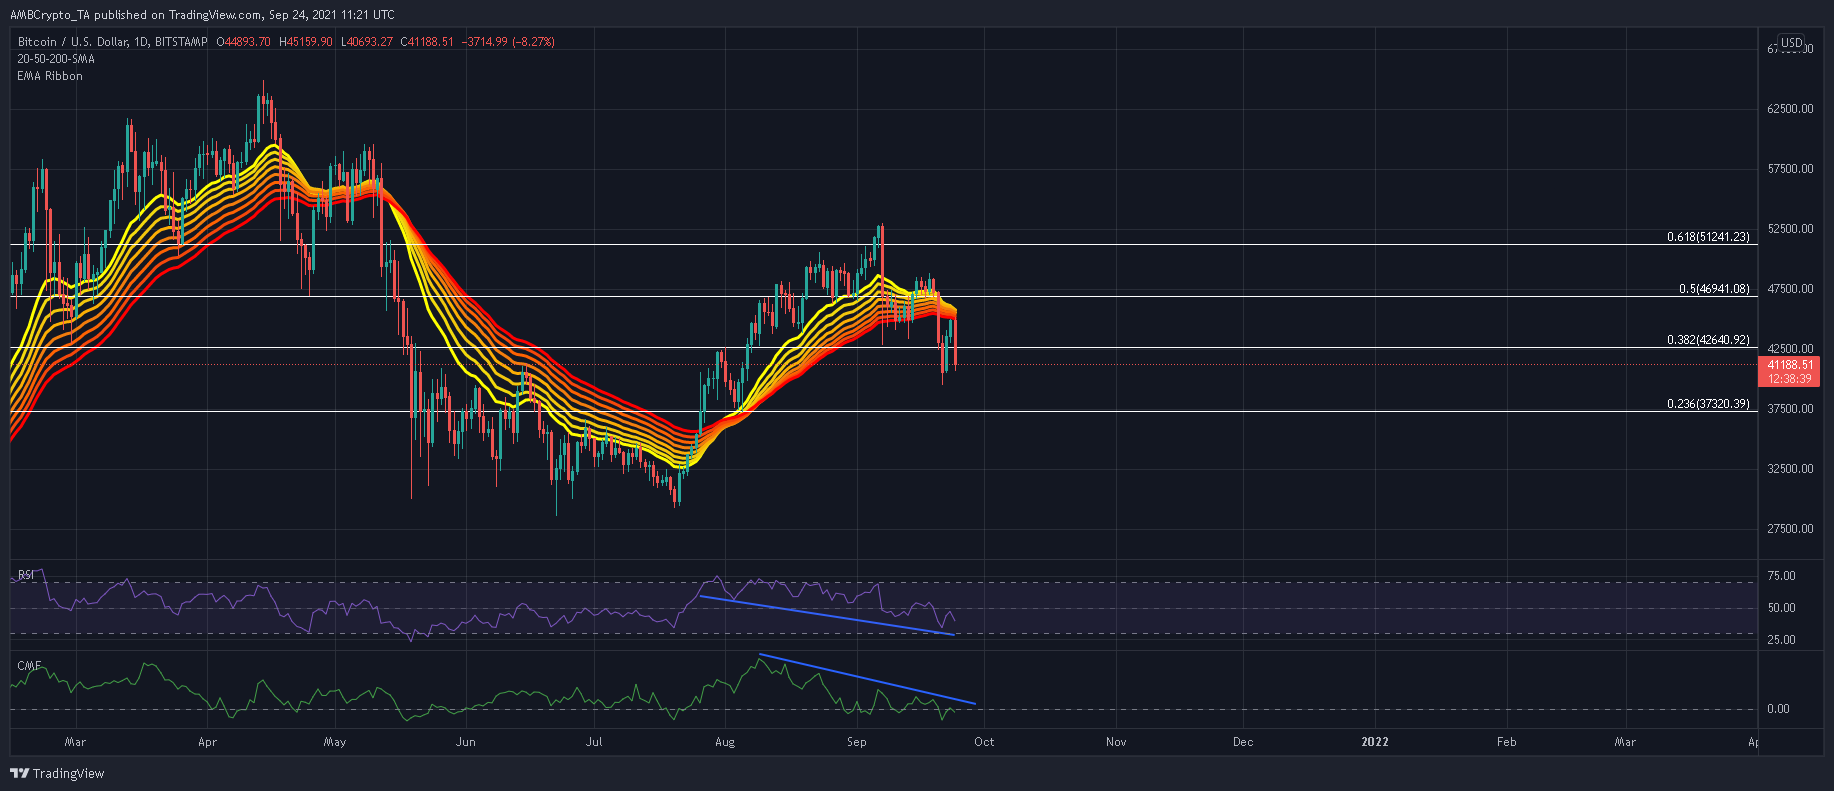
Source: BTC/USD, TradingView
Sellers have been on the move across the BTC market. With the 20, 50 and 200 Simple Moving Averages poised for the bears, BTC seemed to be under a major threat of extending below its 23.6% Fibonacci level. Such a move would bring BTC’s demand zone of $28,475-$29,500 back into play and overall, this would account for another 33% decline from BTC’s press time level.
Now, BTC has renewed bullish momentum within this demand zone several times this year, most notably in June and July. Hence, another dip would provide a platform for buyers to step in and rapidly accumulate BTC at a discounted price.
However, BTC would move into dangerous waters in case of a close below $29,500. Losses could extend to $24,000 or even $20,000 due to the lack of strong support levels. To enforce an immediate reversal, BTC needs to hold above $40,000 and avoid forming a fresher low below $39,600.
The 23.6% Fibonacci level would be the last bastion of defense preventing a slide to the demand zone.
Reasoning
Bitcoin, at press time, had slipped below its EMA Ribbons, which flipped their role to resistance. This was a strong bearish sign considering the fact that BTC held above these moving average lines for nearly 2 months.
The Relative Strength Index also slipped below 50 and lent more assistance to sellers than buyers. According to the Chaikin Money Flow, capital inflows towards BTC have been declining since early August. This bearish divergence needs to be overturned before any talks of a swift comeback on the chart.
Conclusion
The aforementioned factors tainted BTC’s mid-long term outlook. With almost all of its indicators flashing bearish signals, BTC threatened to close below its 23.6% Fibonacci level and bleed further on the charts.
Meanwhile, the market presented only a handful of opportunities for buyers and shorting would be a better option right now. A better time to go long would be when BTC dips to its demand zone of $28,475-$29,500.


