Assessing if Bitcoin’s [BTC] worst sell-off is about to come

Bitcoin [BTC], the largest cryptocurrency, continues to struggle around the $21k line. At press time, BTC suffered a fresh 5% correction as it traded at $21.1k. Well, this is the first half of the story.
The second half of this story narrates a different picture. Herein, the $20k level has created ‘extreme demand’ for BTC, thereby, creating new support levels.
BTC rises from the ashes?
The latest Week OnChain Newsletter published by analytical firm Glassnode discussed shifting momentum as the worst of the sell-offs could be concluded. However, the market still needed time to heal those ‘wounds.’
#Bitcoin has attempted to escape the gravity of the $20k zone in a long awaited relief rally.
Momentum in the short term is favorable, however longer-term indicators suggest additional time may be required to form a firm foundation.
Read our analysis 👇https://t.co/Oi0IykvUNn
— glassnode (@glassnode) July 25, 2022
The on-chain metric of holders supply concentration painted a rather interesting outlook. One where short-term holders showcased a ‘surprising’ positive narrative.
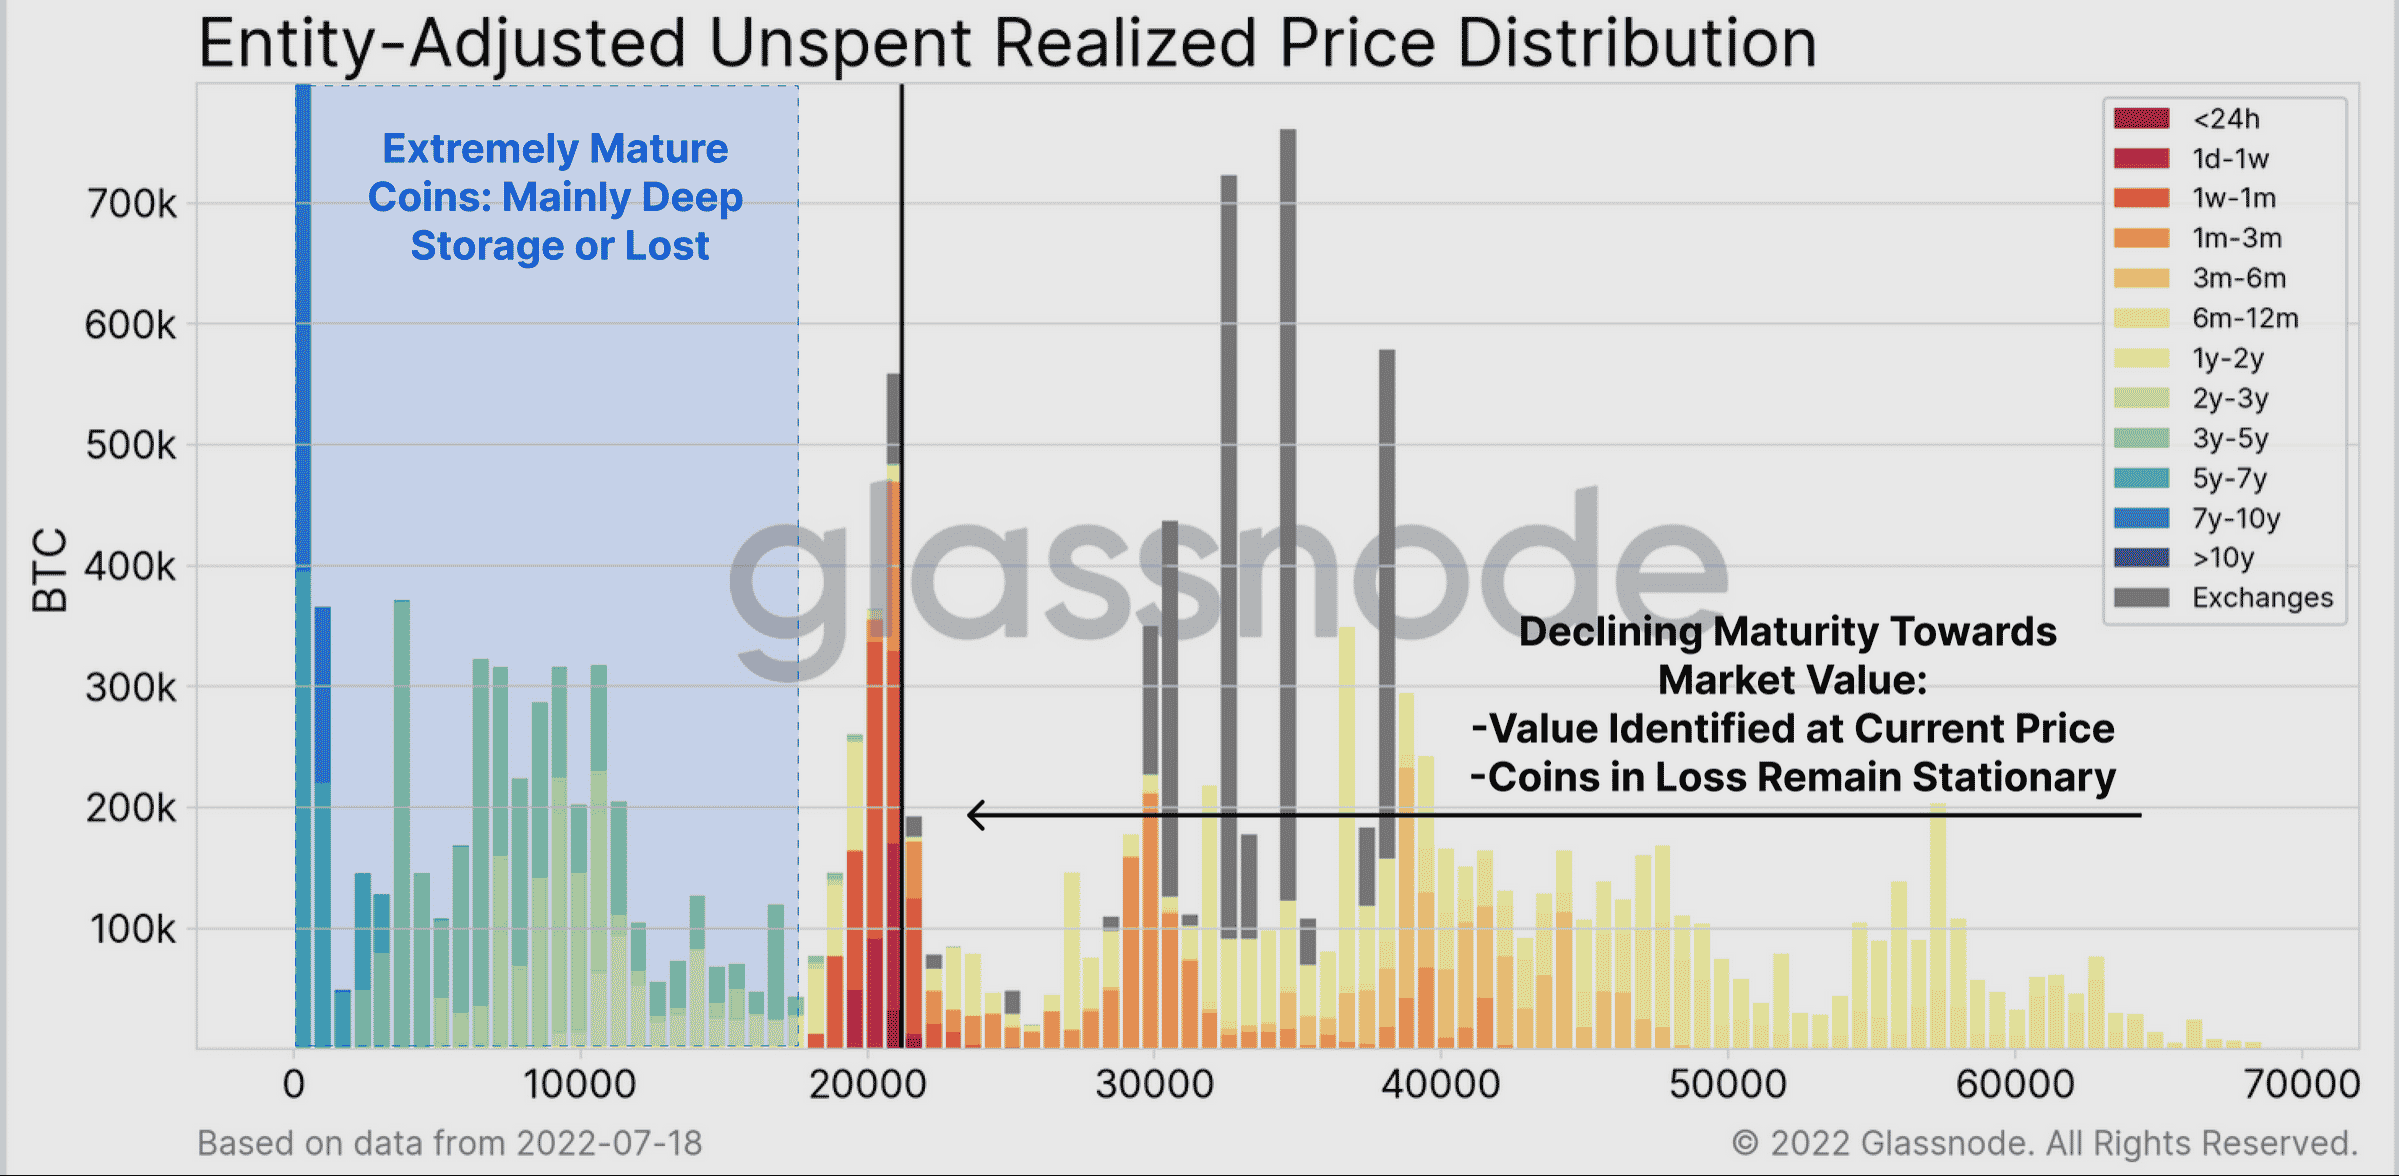
Here the analysis charted long-term versus short-term holders (and exchanges), and measured each group by their “Unspent Realized Price Distribution.”

One might notice more Unspent Realized Price Distribution (URPD) at $20,000 than the other price levels of Bitcoin, which was driven by the Short-Term Holders – who also showed “elevated demand” at $30,000 and $40,000.
The graph pointed to “extreme demand” around the $20,000 region. Furthermore, noting each psychological price level from $40,000 to $30,000 to $20,000 as it created a new group of STHs. In this context, Glassnode added.
“It would be constructive to see these STH held coins at the $40k-$50K level start to mature to LTH status over coming weeks, helping to bolster this argument.”
Even though this could be a good start for BTC’s holders, the crypto market is still recovering, especially for long-term holders.
Many long-term holders contributed to the sell-side, and the URPD charts essentially represented the ‘post-dust settling’ condition to date.
These high supply concentration nodes might act as firm resistance when the market attempts to recover higher.
But patience would be key here. This was the same duration that LTHs experienced during the 2018 bear market looking at their past profitability.

Herein, LTHs saw their recent profitability drift significantly below their yearly performance, for almost 400 consecutive days. The decline reached a similar duration and depth to the 2018 bear market lows. Thus, providing added weight to the arguments made above.
To sum it up, Glassnode opined,
“Momentum in the short-term suggests continuation of the upswing, provided the Realized Price and Long Term Holder Realized Price can hold as a support level. On the long-term, momentum suggests the worst of the capitulation could be over, however a longer recovery time may be required as foundational repair continues.”