Assessing if MATIC bulls can accommodate another 10% rally after this bullish crossover

Disclaimer: The information presented does not constitute financial, investment, trading, or other types of advice and is solely the writer’s opinion.
MATIC buyers ultimately gathered enough thrust to propel a bullish flip on the EMA ribbons over the last week. After witnessing a solid buying spree, the alt floated above the 38.2% Fibonacci level.
Bulls breached the previous Fibonacci levels after the ascending triangle breakout. A sustained bullish effort could aid the bulls in inflicting a retest of the 50% Fibonacci level in the coming sessions. At press time, MATIC was trading at $0.8448, down by 4.45% in the last 24 hours.
MATIC Daily Chart
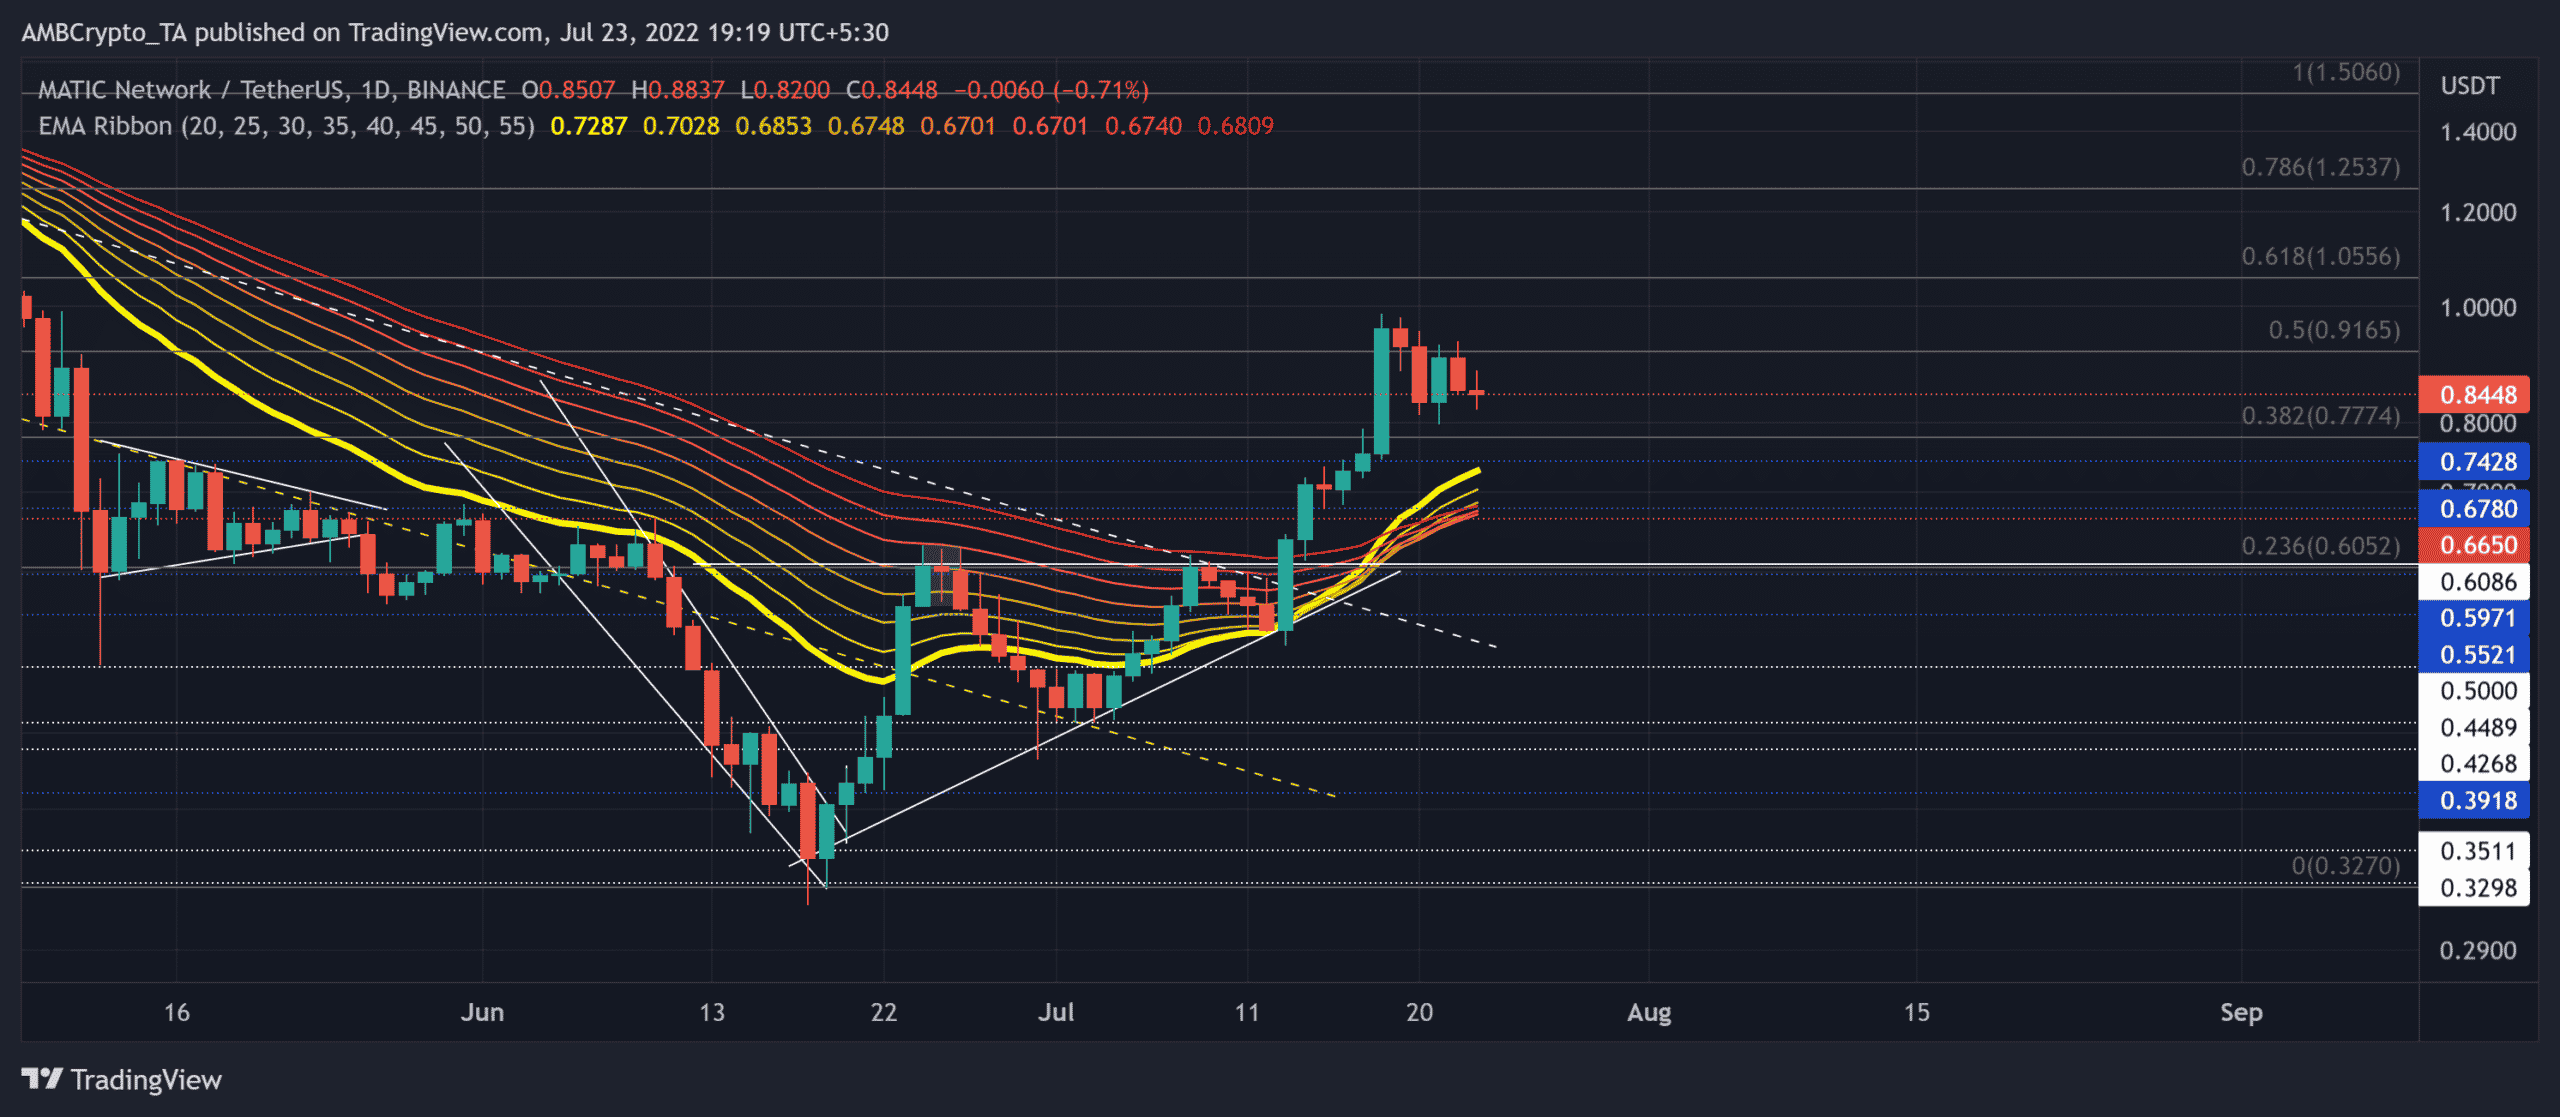
The altcoin witnessed an expected mid-June reversal from the 23.6% Fibonacci resistance and lost over 50% of its value from 10-18 June. Owing to the market-wide revival, buyers recouped to provoke a bullish pattern in the daily timeframe.
This reversal opened doorways for a break above the northbound EMA ribbons. Historically, bullish flips on these ribbons result in bulls ensuring support near the 20-30 EMA. Also, the buyers broke out of the constraints of its trendline resistance and flipped it to support (white, dashed).
The fall from the 50% level could see rebounding opportunities in the $0.77-$0.73 range. In this case, the bullish resurgence could push the alt to retest the $0.9-zone before a trend committal move.
To shun the buying inclinations, the bears needed to inflict a close below the $0.6-level. Here, the immediate trendline support could provide bounce-back opportunities from the $0.57-$0.55 range.
Rationale
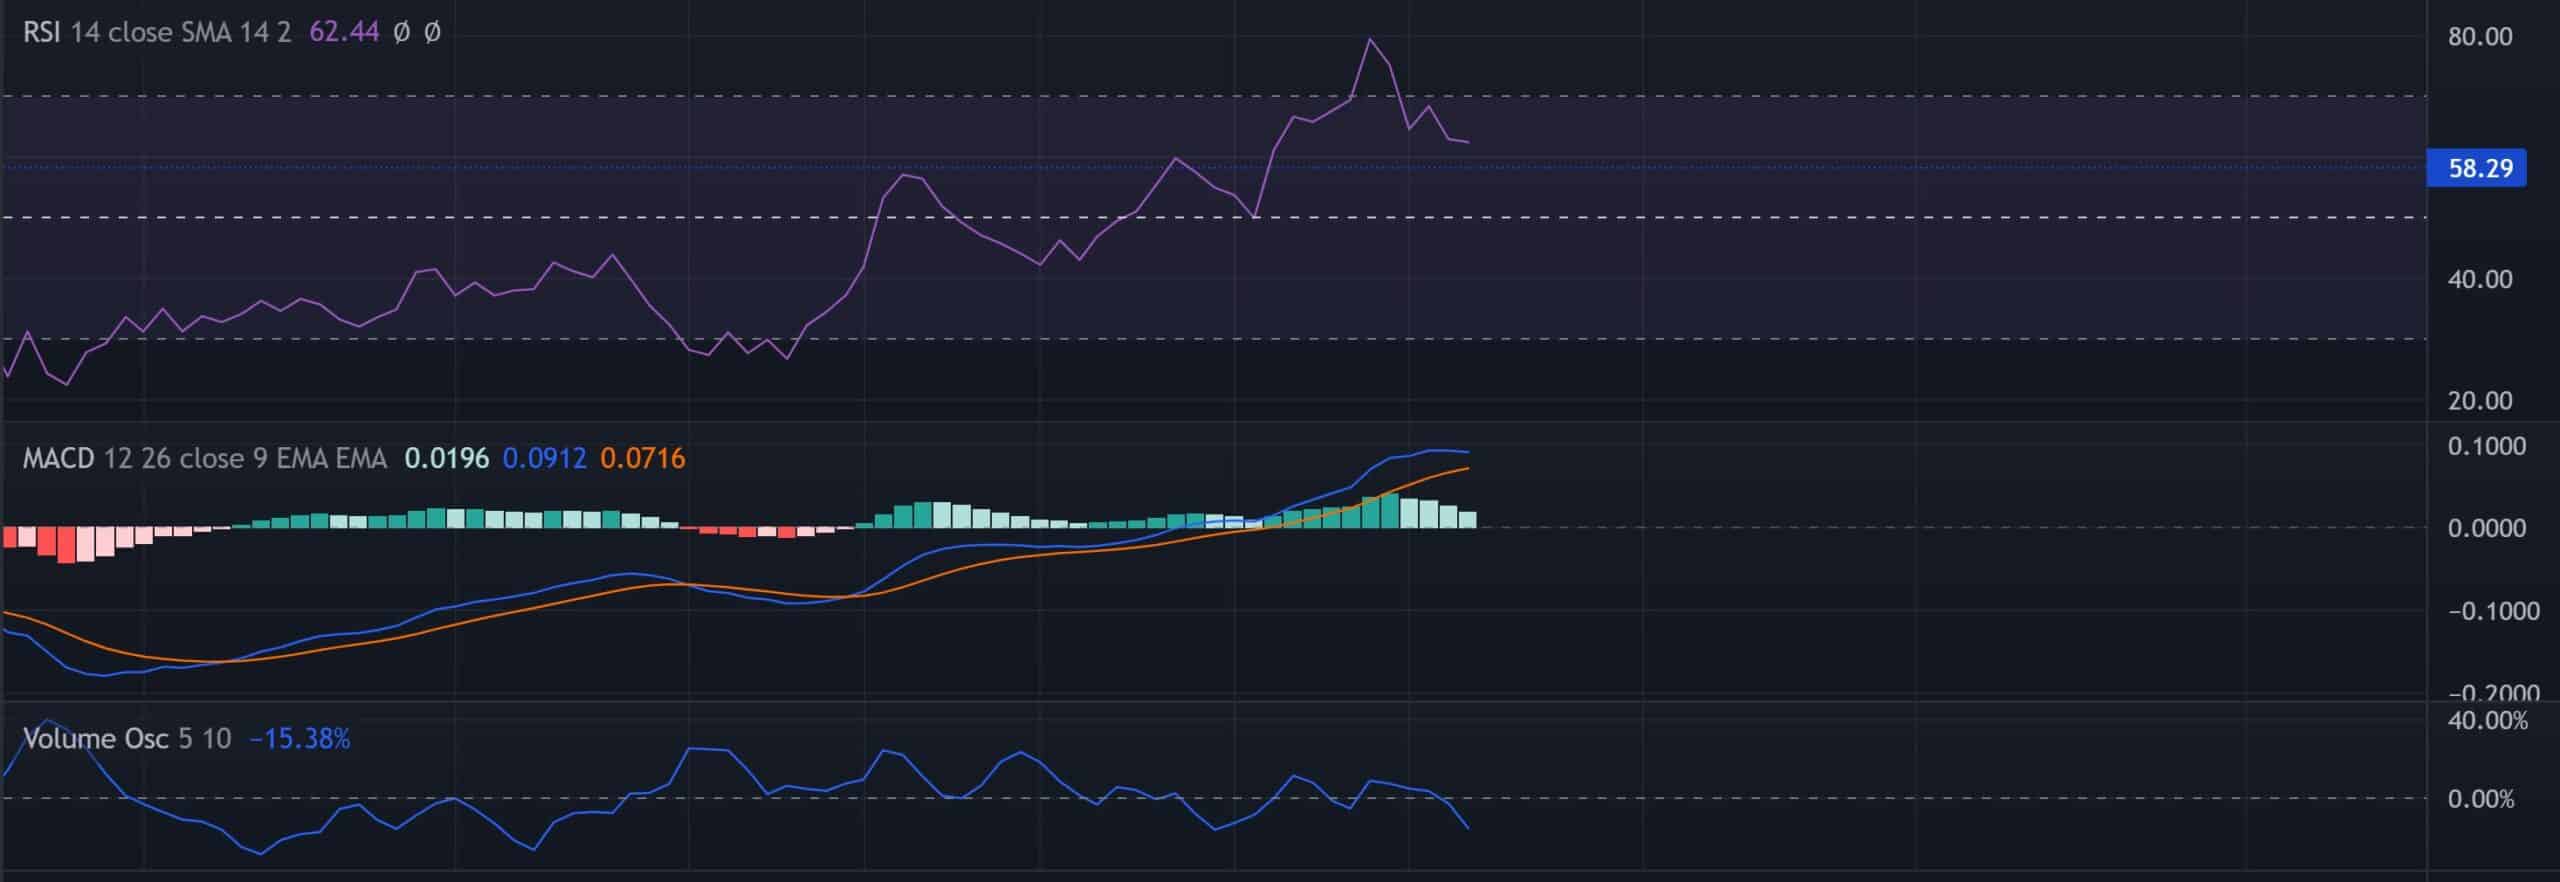
The Relative Strength Index (RSI)’s recent growth saw an expected reversal from the overbought region. A sustained position above the 58-mark support could aid the near-term buying endeavors. Also, the Moving Average Convergence Divergence (MACD) lines comfortably placed themselves above the equilibrium to depict a strong buying momentum.
Furthermore, the recent buying volumes have exceeded the selling pressure to depict a strong bull move. But buyers need to ensure the $0.74 baseline to prevent fallout.
Conclusion
MATIC’s recent break above its EMA ribbons has reflected a bullish sentiment for the coin. The targets would remain the same as discussed above.
However, investors/traders must keep a close eye on Bitcoin’s movement as MATIC shares a staggering 86% 30-day correlation with the king coin.