

![Stellar [XLM] news](https://ambcrypto.com/wp-content/uploads/2023/09/Stellar_News_1200x900-1024x768.png)
- XLM price increased and short liquidations could send the price higher.
- If Open interest continues to increase, XLM may reach $0.15.
Unlike the broader market, Stellar [XLM] gained as much as 10.87% in the last 24 hours. This made it the altcoin with the best performance out of the top 20 assets. While the Stellar network has not had any significant development lately, Santiment noted that the price could still go higher.
📊 As the new week has kicked off, #Stellar is the notable asset that is showing mini breakout potential, with a +8% rise today. $XLM is an asset that has been consistently #shorted by the crowd, and liquidations could pump up the price. Also, keep an eye on $TON, $XMR, and $ARB. pic.twitter.com/ju15ghk1ek
— Santiment (@santimentfeed) September 4, 2023
Read Stellar’s [XLM] Price Prediction 2023-2024
A “Stellar” start to the week
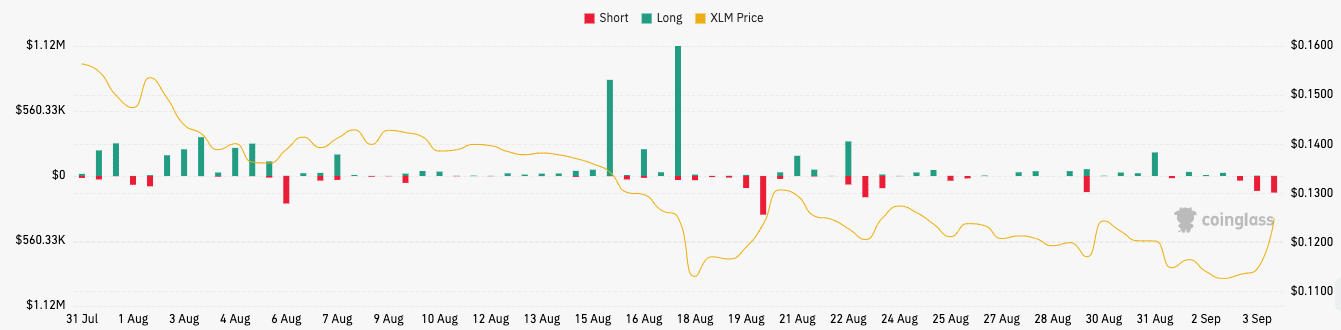
The on-chain analytic platform, in its 4 September tweet, noted that most traders have been bearish on XLM since a lot of short contracts were open. However, the tweet above also suggested that a hike in liquidations could further strengthen price direction.
According to Coinglass, the 24-hour XLM liquidations were $311,570 with shorts accounting for almost all of it. Liquidation occurs when an exchange closes a trader’s open contract due to a partial or total loss of the trader’s initial margin.
This event happens when a trader is unable to meet the margin requirements for the said position or fails to have sufficient funds to keep the trade open.
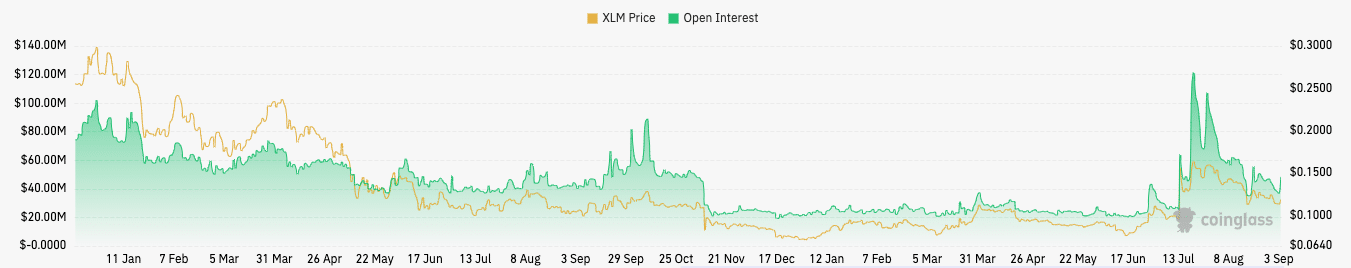
However, the liquidations have not stopped traders from opening more XLM contracts, as shown by the volume and Open Interest (OI). At the time of writing, the Open Interest on XLM had increased by 64.30% as it reached $60.15 million.
The volume, on the other hand, surged by 577.60%, hitting $265.96 million in the process. Used as an indicator to determine the strength behind prices, Open Interest is the total number of futures contracts held by market participants at the end of the trading day.
So, the hike in the indicator suggests that there is a likelihood of XLM surging higher than the current value. According to Coinglass, if the Open Interest continues in the upward direction, then XLM may approach $0.15.
Buying momentum prevails
But what does the technical outlook suggest? At press time, the XLM/USD 4-hour chart had already formed a bullish structure. Furthermore, the Directional Movement Index (DMI) also supported the notion that XLM’s price may continue to increase.
At press time, the +DMI (green) was 39.08. On the other hand, the -DMI (red) was down to 12.57. The difference between the +DMI and -DMI suggests bulls were in control of the market, and sellers were nowhere near close to authority.
Is your portfolio green? Check the Stellar Profit Calculator
Also, the Average Directional Index (ADX) was 29.70. Whenever the ADX (yellow) is above 25, it means that the directional strength is solid. If the ADX were to be less than 25, it implies a weak directional strength.
![Stellar [XLM] price action](http://ambcrypto.com/wp-content/uploads/2023/09/XLMUSD_2023-09-04_12-33-25.png)