Assessing Solana’s state in Q1- What’s ahead for the next quarter
Solana’s daily unique fee payers and daily transactions have gained upward momentum since the beginning of the last quarter.

- Solana’s revenue increased 68.7% in the first quarter of 2023.
- Its NFT space continued to grow despite a few migrations.
Messari recently posted its latest report highlighting Solana’s [SOL] performance in the first quarter of the year. One of the most notable takeaways was its market capitalization growth which increased by over 100% quarter over quarter.
.@JamesTrautman_ 's State of @solana Q1 23' report ⬇️
+Market cap rebounded, increasing 118.1% QoQ
+TVL denominated in USD increased by 23.5%
+NFT sales denominated in $SOL increased 19.3%, reaching ATHsFREE report link in the next tweet👇 pic.twitter.com/xB4O2BSzib
— Messari (@MessariCrypto) April 23, 2023
Realistic or not, here’s SOL’s market cap in BTC terms
Decoding Solana’s Q1 performance
As per the report, Solana’s daily unique fee payers and daily transactions have gained upward momentum since the beginning of the last quarter.
Thanks to these upticks, Solana’s revenue in SOL increased by 68.7%, which looked promising for the network.
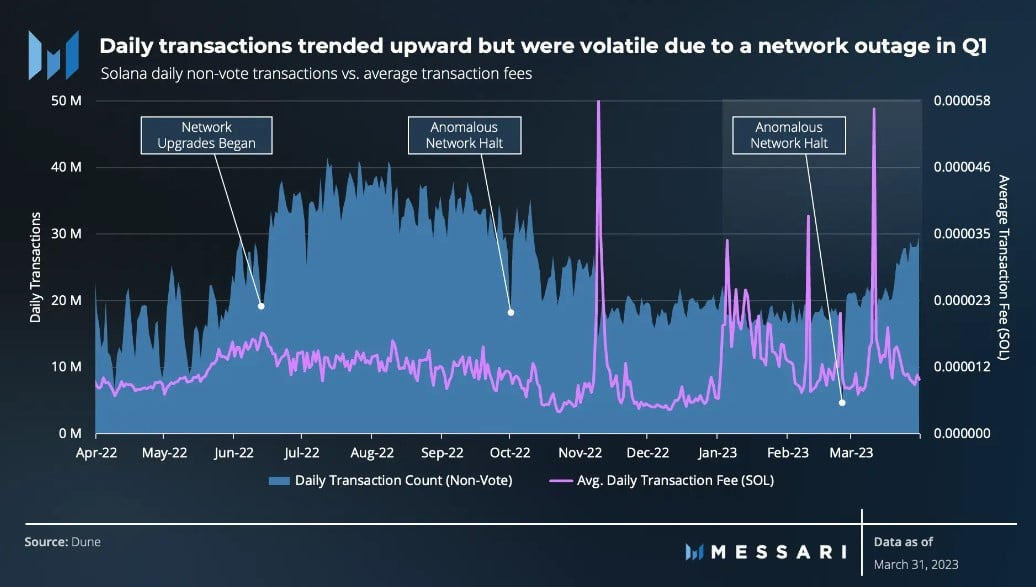
One of the prominent reasons for fee payer and transaction activity during Q1 was the BONK airdrop.
However, the daily transactions showed some volatility in February. This happened mainly because of Solana’s network outage that occurred during the same period.
Additionally, the network moved closer to a more decentralized state as the average number of validators climbed by 18.9% QoQ.
Solana and DeFi space
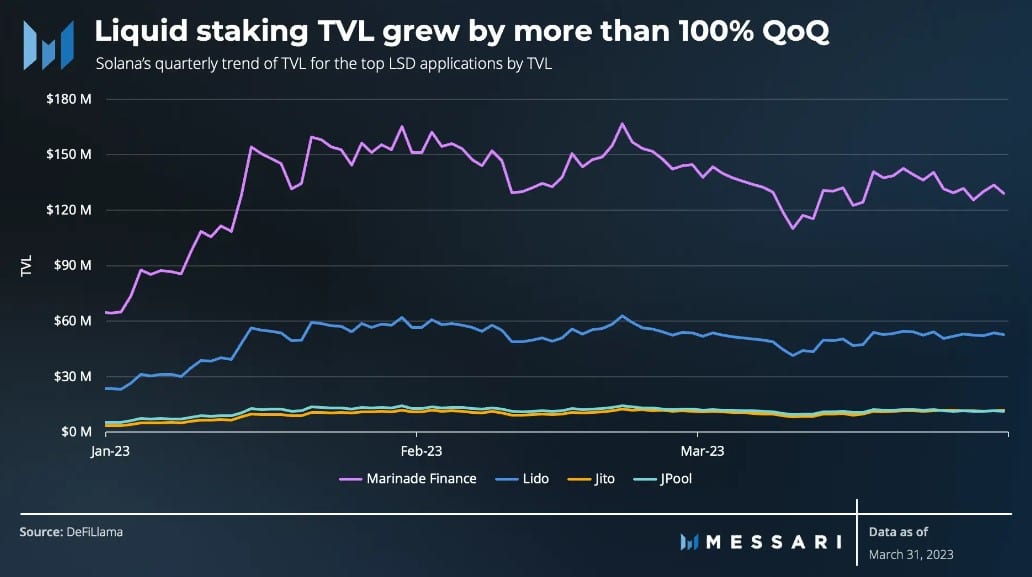
Similar to revenue, Solana’s DeFi space also witnessed growth over the last quarter. This was evident as SOL’s TVL went up by more than 23% in the last three months.
Interestingly, TVL denominated in SOL fell by 40.7%, indicating that TVL was driven more by new capital influxes than by asset price rises in USD. Moreover, liquidity-staking TVL registered growth of 100% QoQ.
NFT space grew despite a few roadblocks
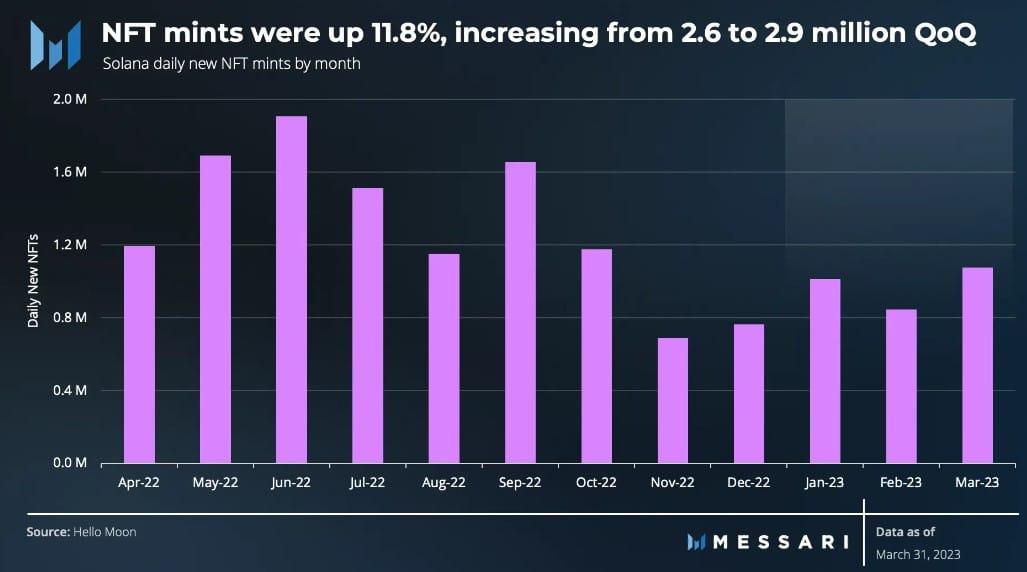
Messari’s report pointed out that the total number of daily new NFTs increased from 2.6 million to 2.9 million.
NFT sales denominated in SOL increased by 19.3% and reached an all-time high. This growth was achieved even though a few top NFT collections on Solana migrated to other blockchains such as Polygon [MATIC] and Ethereum [ETH].
Solana in Q2 2023
The beginning of Q2 was not as good as Q1, something that is pretty evident from SOL’s price action. The token’s price registered an uptick on 10 April, but later it plummeted.
According to CoinMarketCap, SOL’s price has declined by over 15% in the last seven days. At press time, it was trading at $21.23 with a market capitalization of more than $9.3 billion.
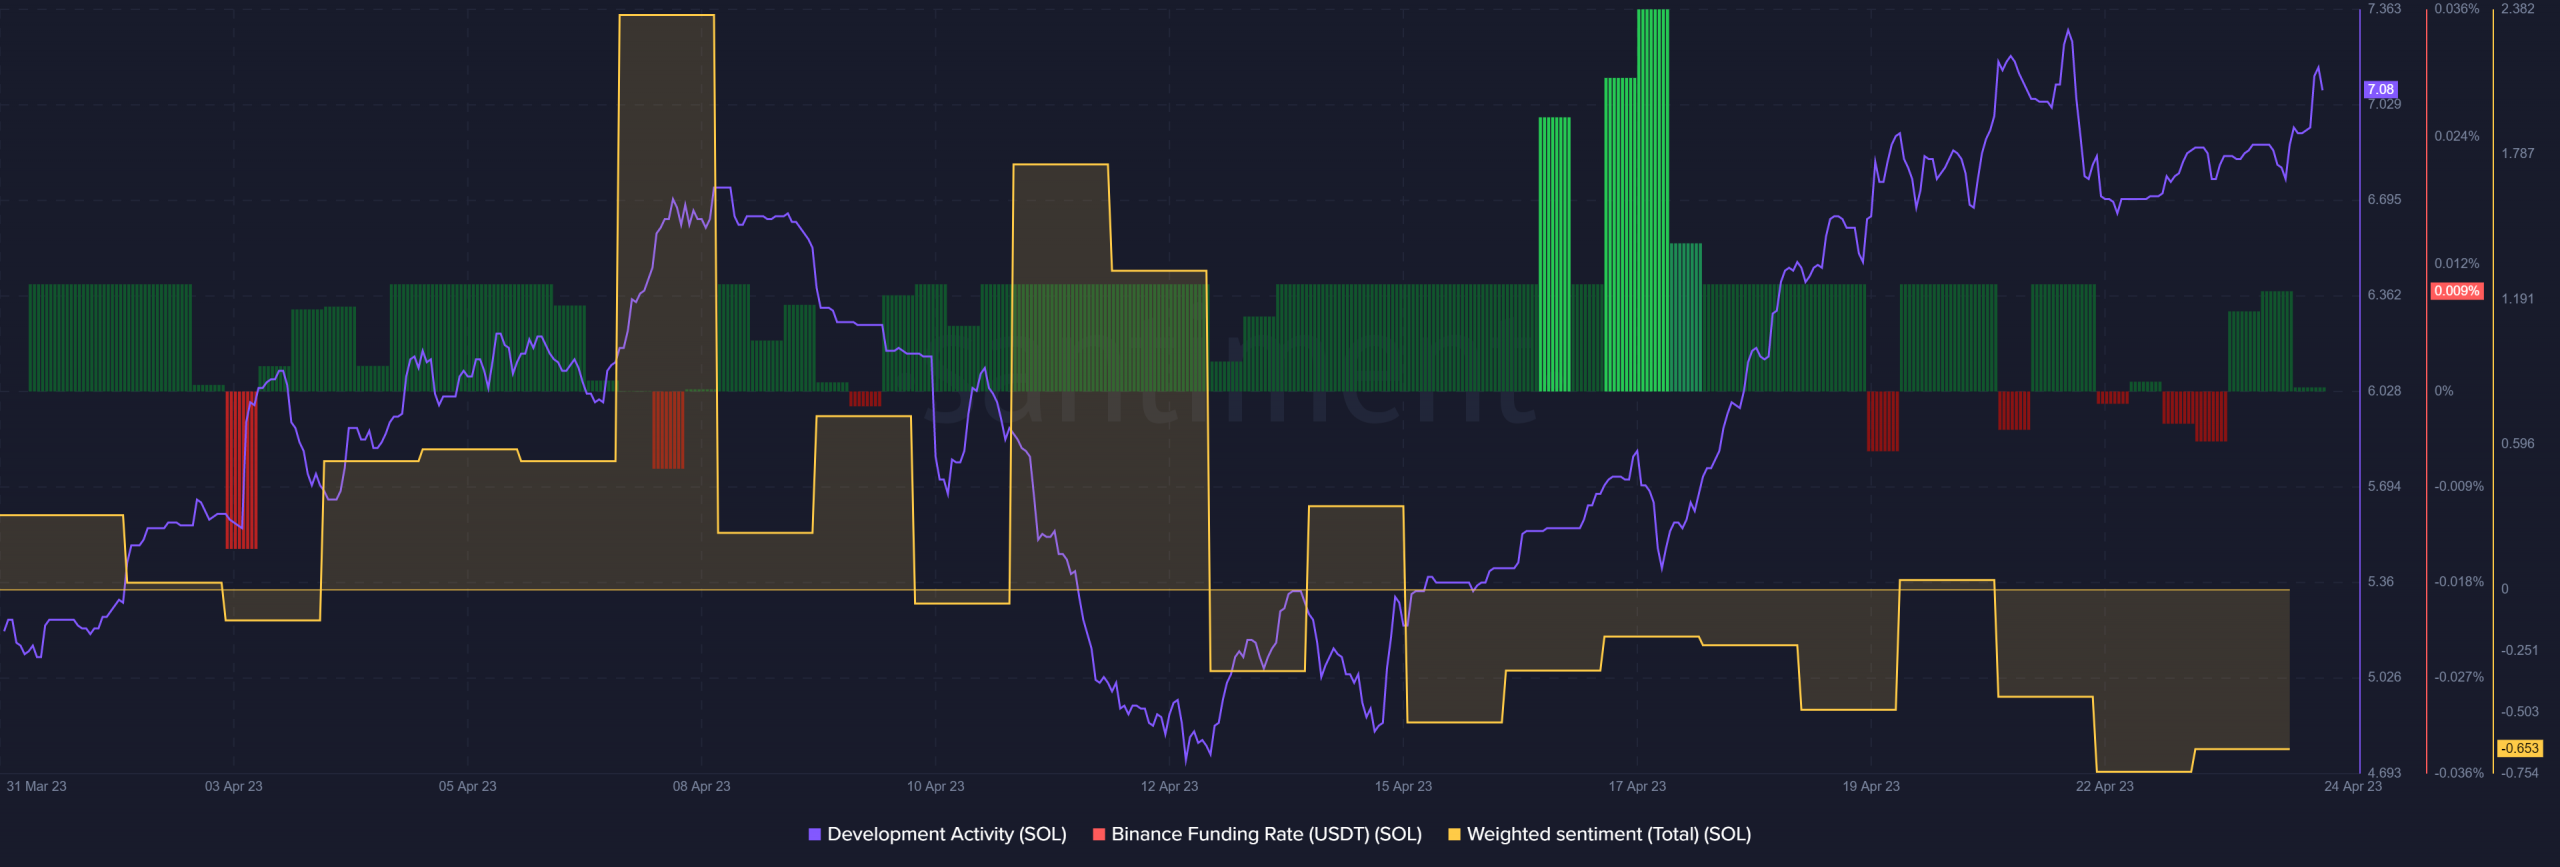
On the other hand, SOL’s weighted sentiment metric remained low over the last few weeks. Thus, suggesting less confidence.
However, the network’s development activity was high, which was a positive sign in itself.
Furthermore, SOL’s demand in the derivatives market was stable, as per the reading of the Binance funding rate.
Read Solana’s [SOL] Price Prediction 2023-24
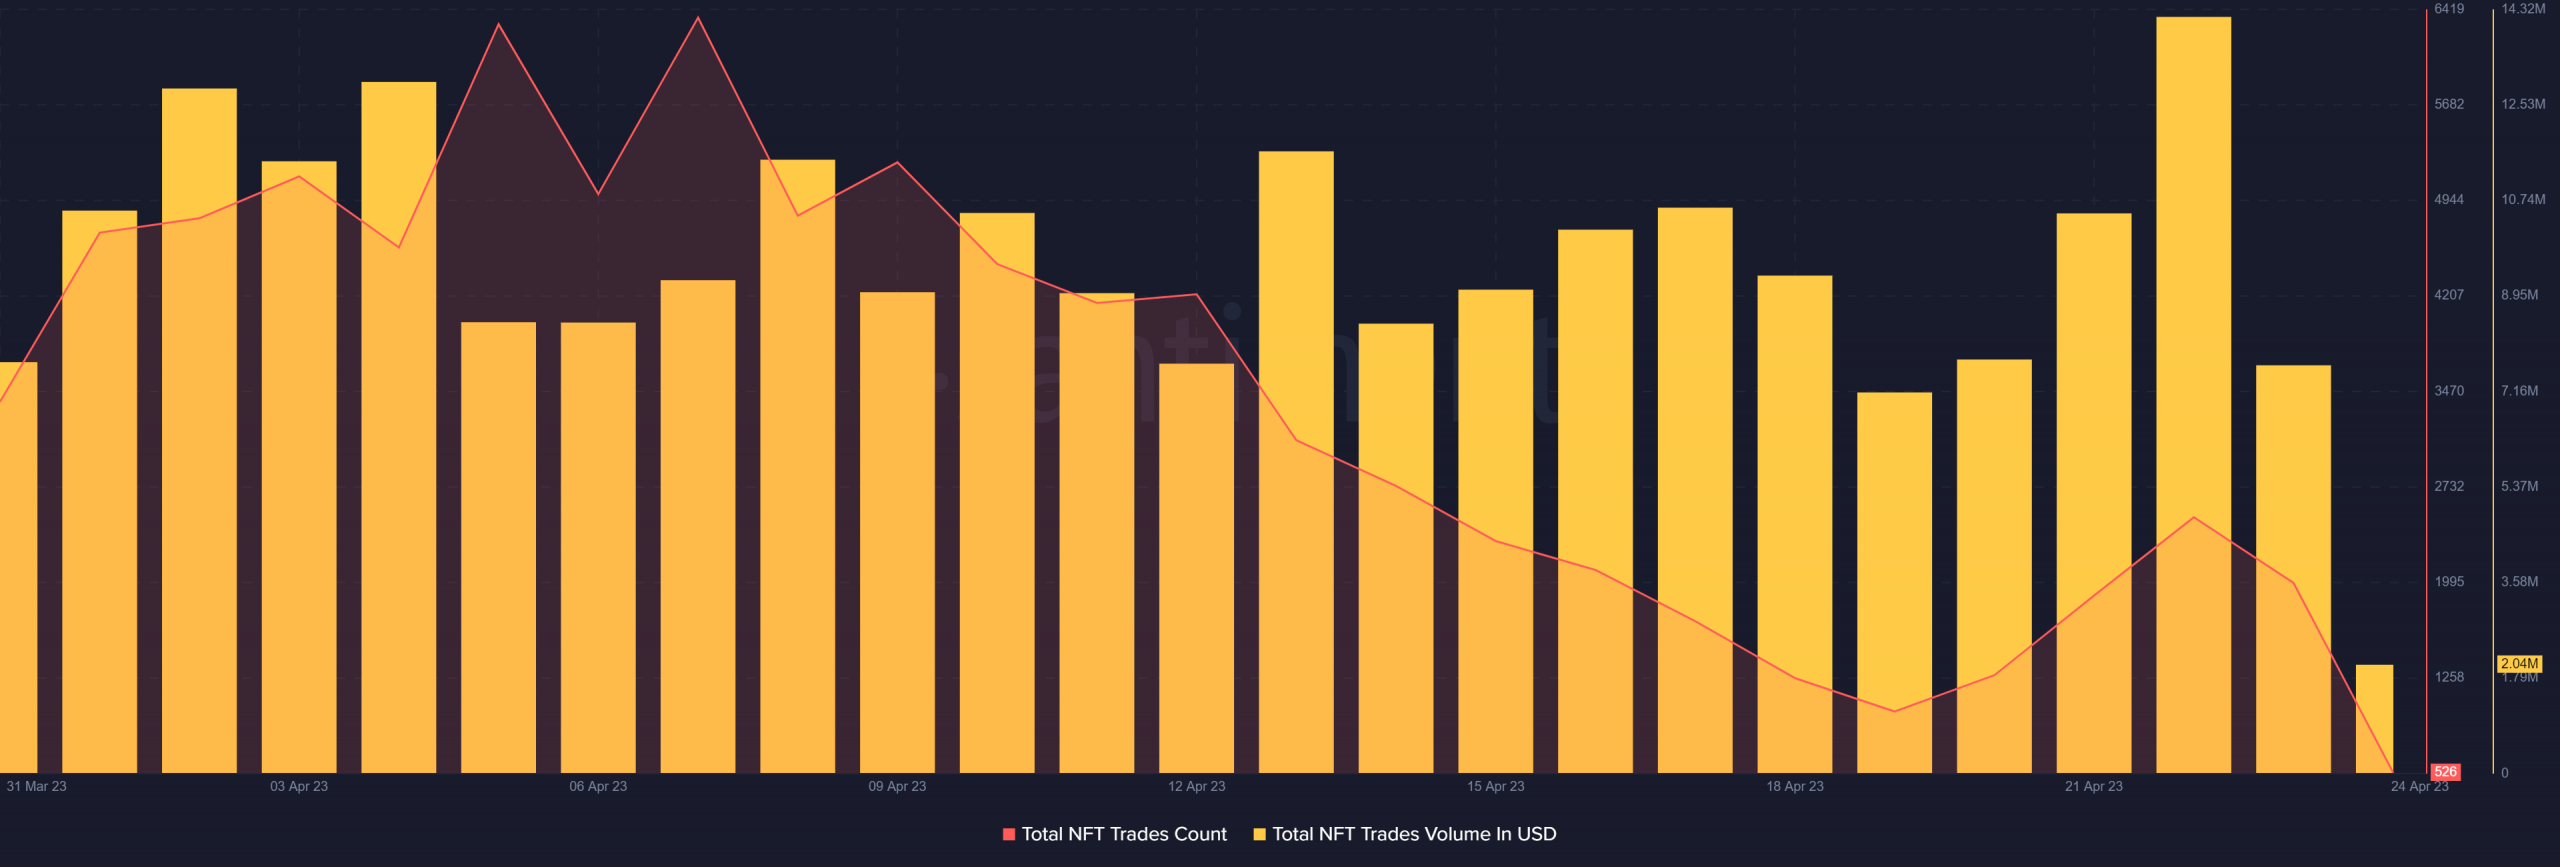
Meanwhile, as per CRYPTOSLAM, Solana’s NFT sales volume increased by more than 120% last week. Not only that, but SOL’s NFT trade volume in USD also remained high. However, a decline was noted in terms of the total number of NFT trades count.