- Altcoin market as a whole displayed weakness over the past three months
- This led to falling investor confidence and reduced stablecoin inflows to exchanges
At the time of writing, the total crypto market cap stood at $2.72 trillion, with Bitcoin’s [BTC] dominance standing at 61.2%, according to CoinMarketCap. This hinted at a 28% drop from its December highs – A time when the total market cap was $3.73 trillion.
The bearish sentiment across the market is due to macroeconomic events unfurling over the past three months, as well as the relative weakness of most altcoins. Including the leader Ethereum [ETH]. According to AMBCrypto, this altcoin trend is likely to continue.
Understanding the altcoin market using Tether flows and volume
Altcoins have not done well in recent weeks. The drop in the altcoin market cap came alongside a drop-off in the trading volume for various leading altcoins.
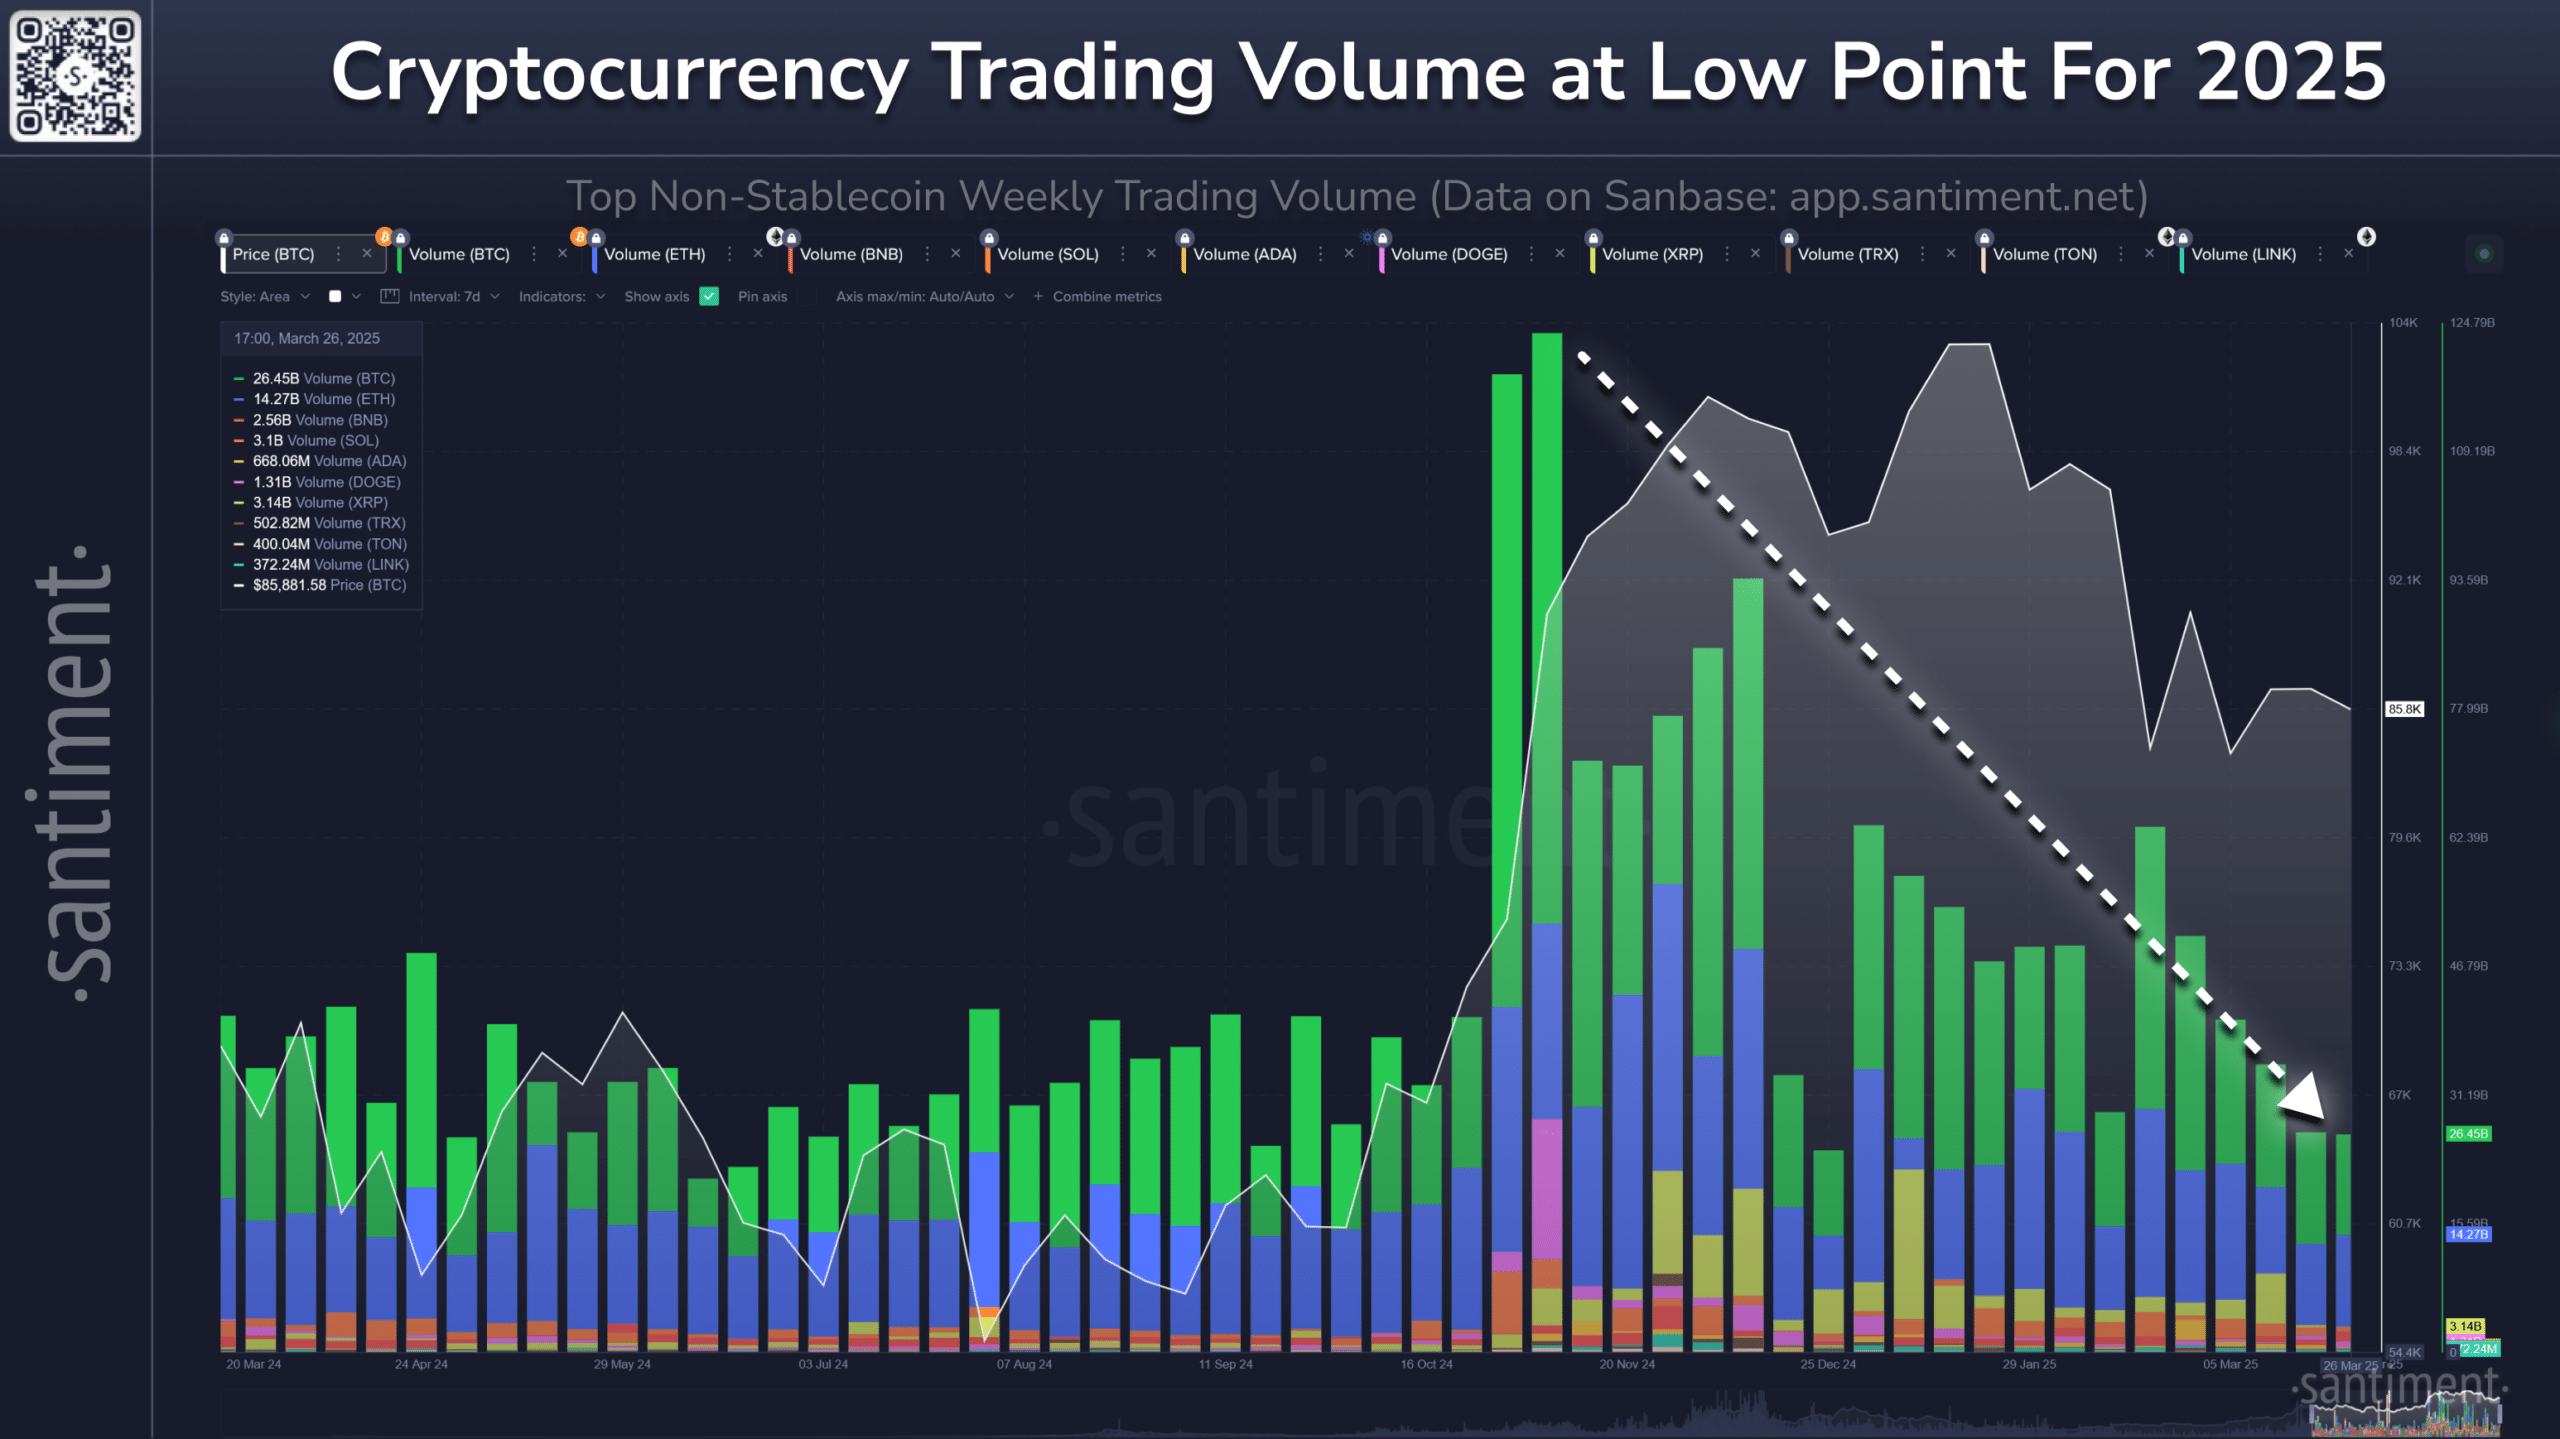
Source: Santiment
In fact, data shared by crypto analyst Brian on Santiment revealed that the top 10 crypto assets’ trading volume now is roughly just a fourth of the volumes seen in early December.
This could mean a growing tendency to take profits or HODL from investors, while also hinting at traders’ fatigue.
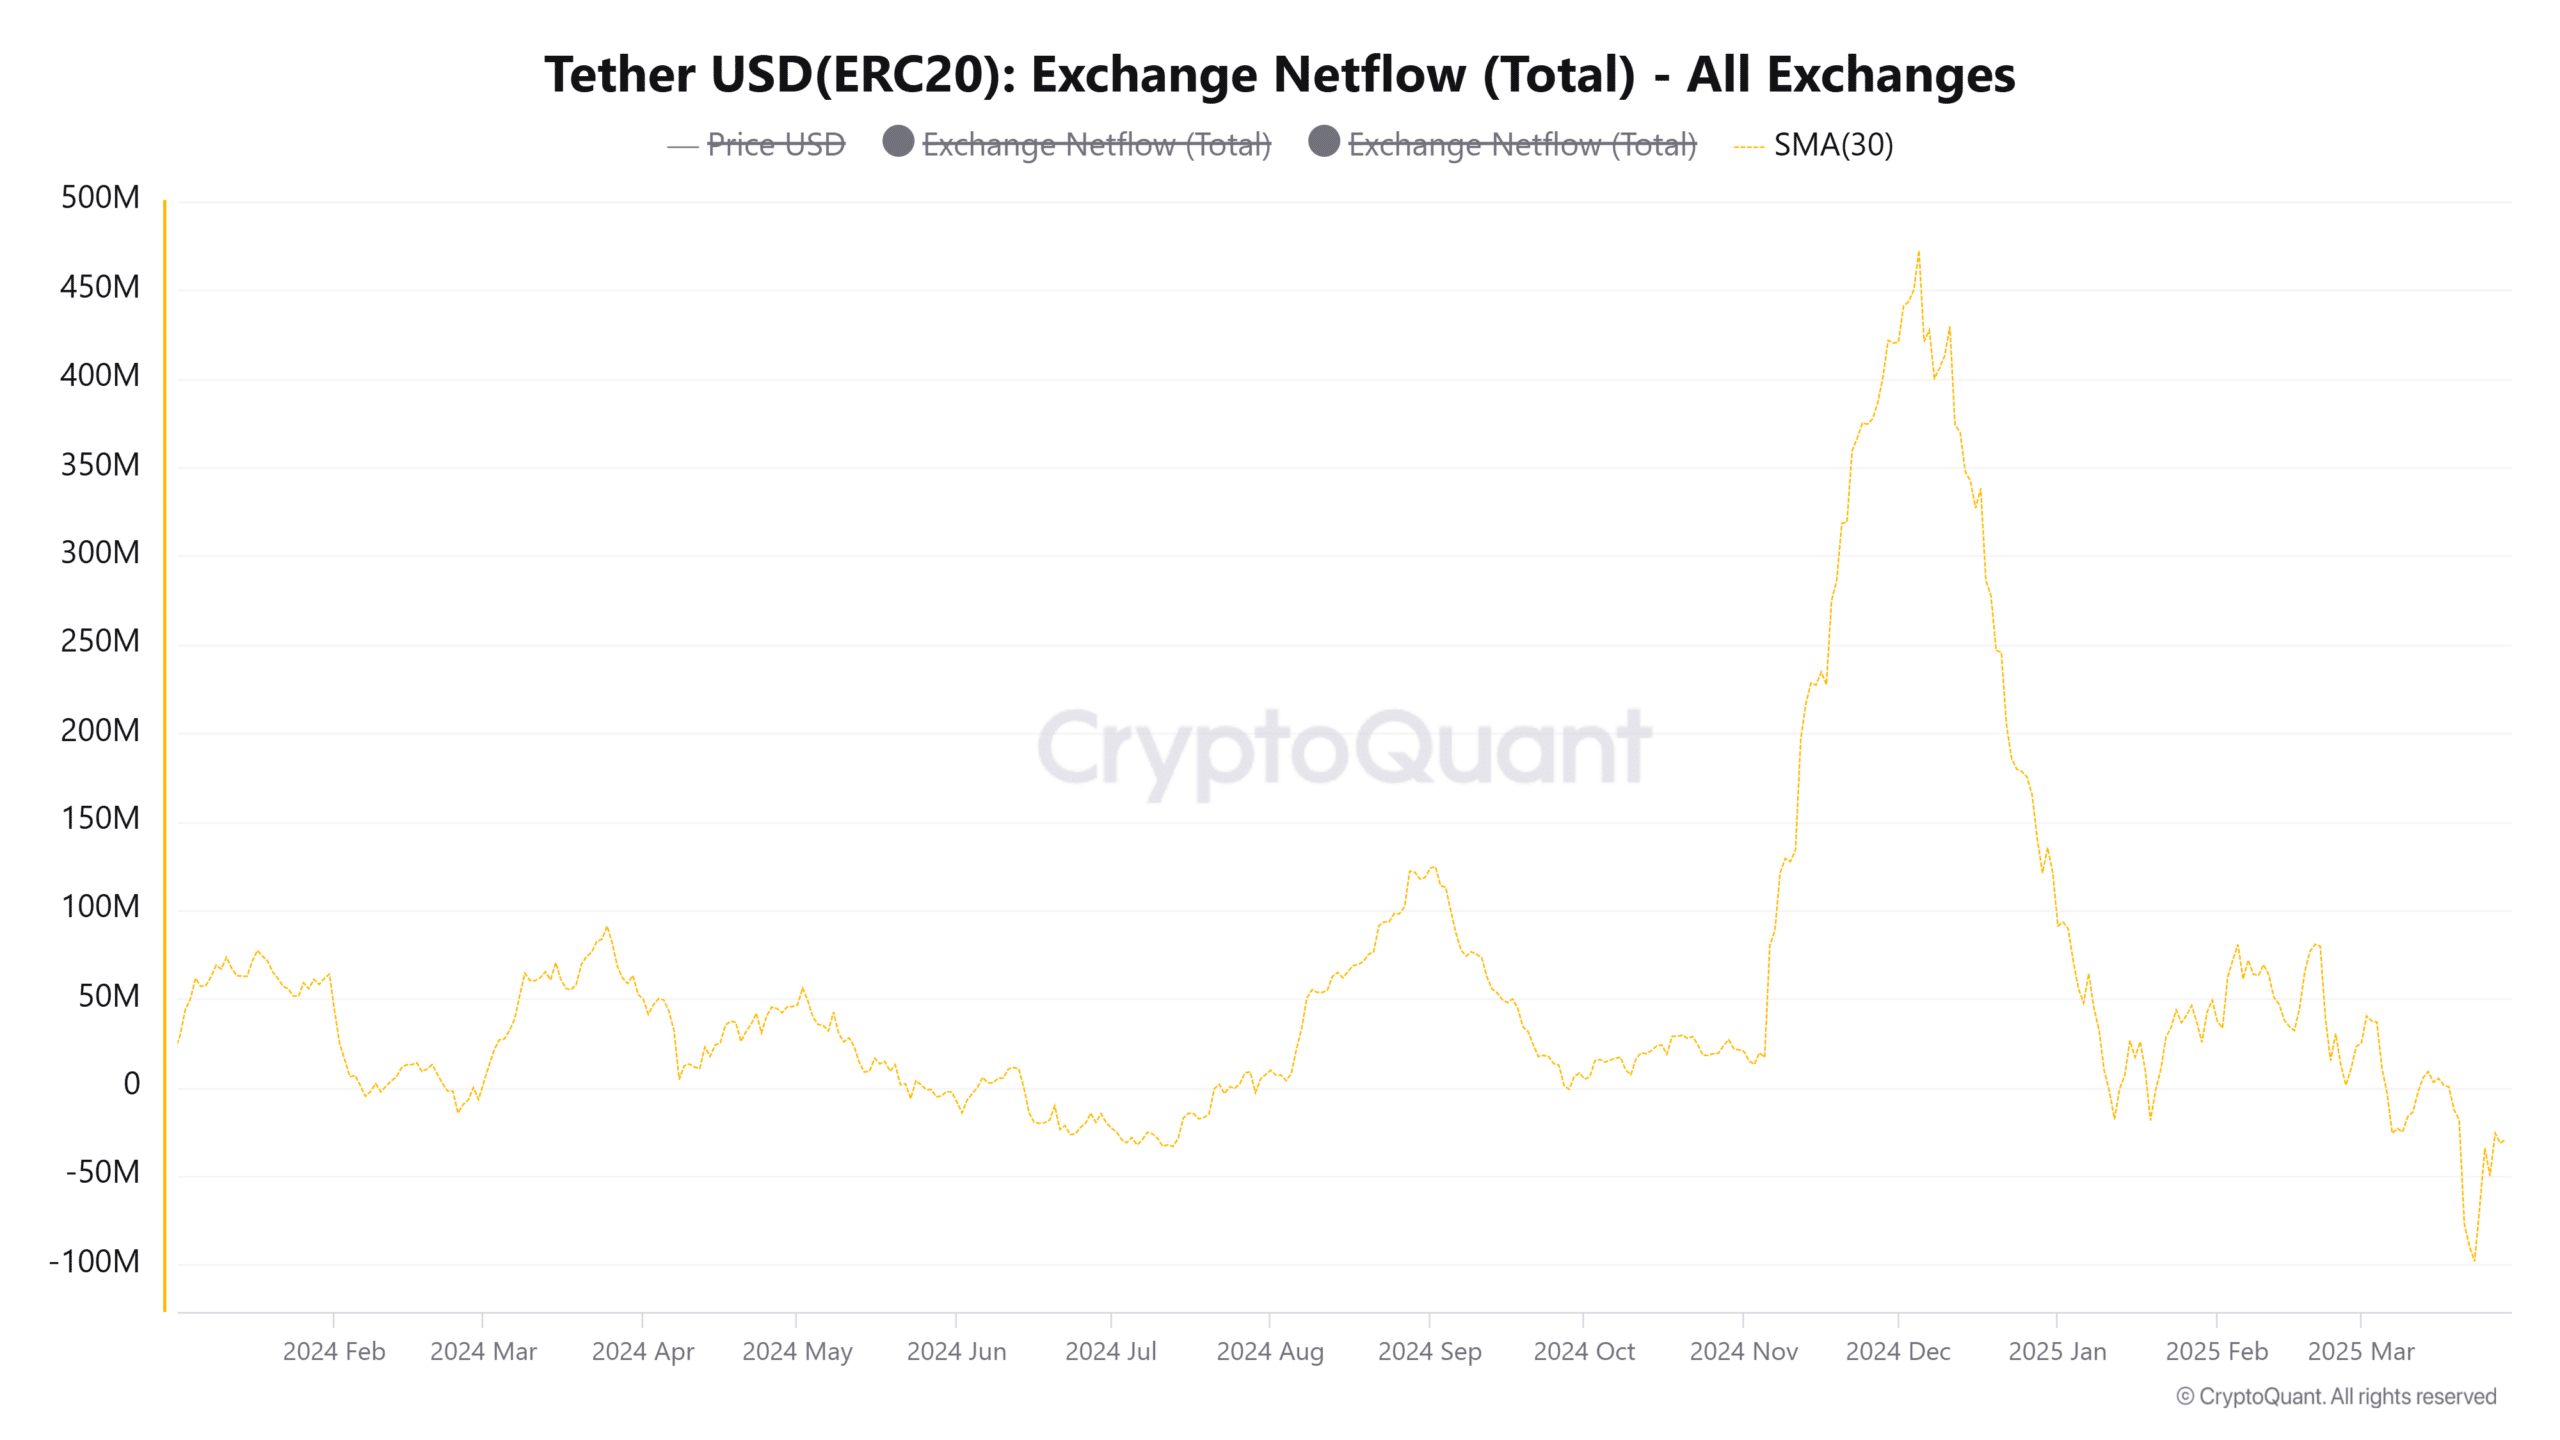
Source: CryptoQuant
The Tether [USDT] netflows chart to exchanges also highlighted adverse investor sentiment. The metric’s 30-day moving average shot skywards in November and December. A hike in stablecoin inflows usually signals more buying power in the market and outlines bullish market sentiment.
The drop-off in inflows over the past two months highlighted that market participants have been more inclined to take profits. The metric has reached lows not seen since November 2022, during the FTX implosion.

Source: TOTAL3 on TradingView
The TOTAL3 chart tracks the market cap of popular crypto assets, excluding BTC and ETH. This way, the altcoin market’s trends would be more apparent. The market cap has been trending south since February.
The $750 billion zone served as support in November, and again in early March. The downward march of the altcoins seems likely to test this level once again.
Given the bearish trend over the past three months, the fall in trading activity, and the lack of stablecoin inflows, it may be likely that the altcoin market cap would fall below the $750 billion-mark soon.