
- DEX trading volume’s drop signaled declining activity, but growing unique addresses hinted at potential re-engagement
- On-chain indicators such as the MVRV ratio and SOPR suggested Ethereum may be undervalued
Ethereum DEX volumes drop 50% in a week
Ethereum’s [ETH] DEX market has seen a sharp downturn lately, with weekly trading volumes dropping by nearly 50%.
Over the past month aline, the decline has been even steeper, with the total volume falling from $86.02 billion in January to $14.54 billion in February. It basically represented an 83% reduction in activity.
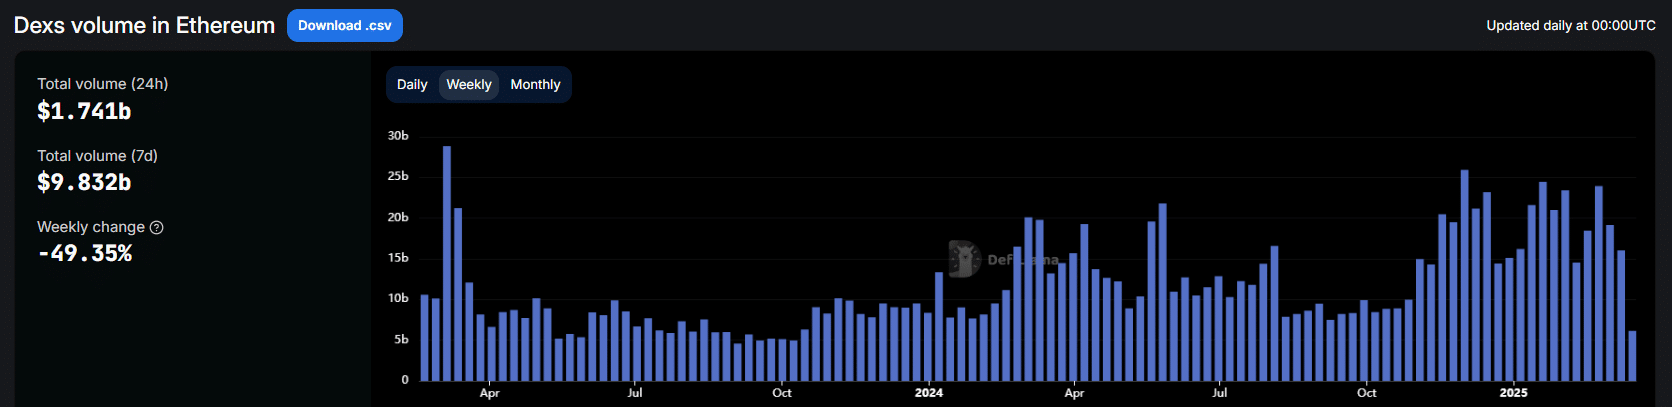
Source: DefiLlama
The fall in trading interest is a sign of weakening engagement, one that naturally raises concerns about Ethereum’s broader market participation.
Despite this decline, however, Ethereum’s unique address count has grown steadily, increasing by 11.93% from January to March.
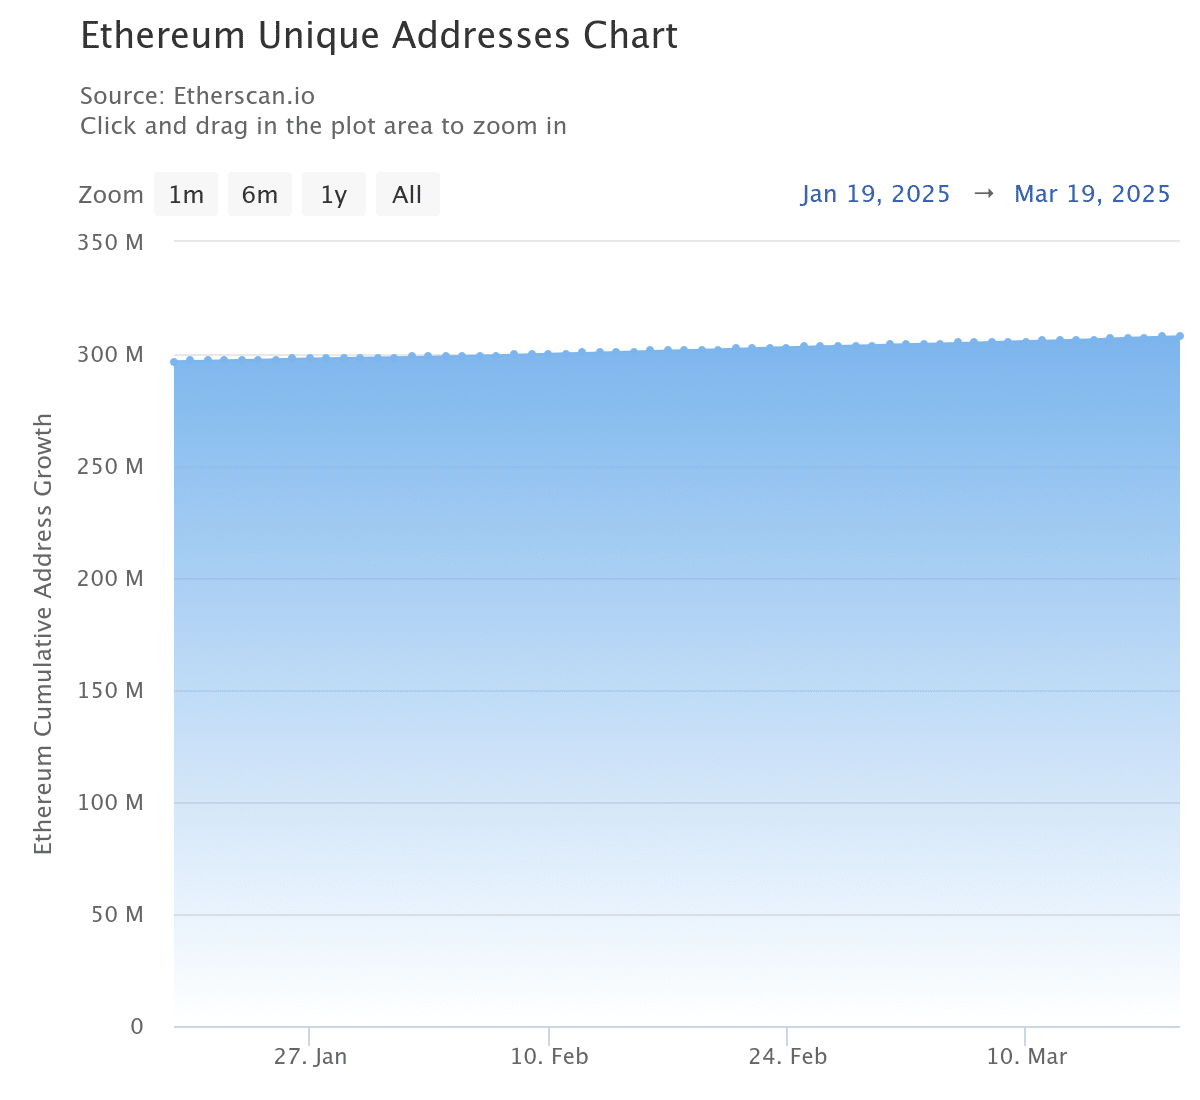
Source: Etherscan
This trend suggests that while new users continue to enter the network, existing participants may be reducing their activity. The contrast between falling trading volumes and rising unique addresses indicated that users may be shifting toward sholding or staking, rather than active trading.
To understand this better, we need to examine the data further.
Fewer hands on deck – On-chain data signals a cooling market
Ethereum’s network activity has fallen lately, with active addresses dropping by 55.4% from 588,782 on 25 January to 262,466 by 16 March.

Source: CryptoQuant
The price mirrored this decline, falling by 43.7% from $3,353 to $1,887.
Historically, lower address activity can be interpreted to mean weaker demand, raising concerns over Ethereum’s ongoing downtrend.
MVRV sounds the alarm – Is Ethereum undervalued?
Amid the declining network activity, Ethereum’s Market Value to Realized Value (MVRV) ratio fell to 0.9 on the charts.
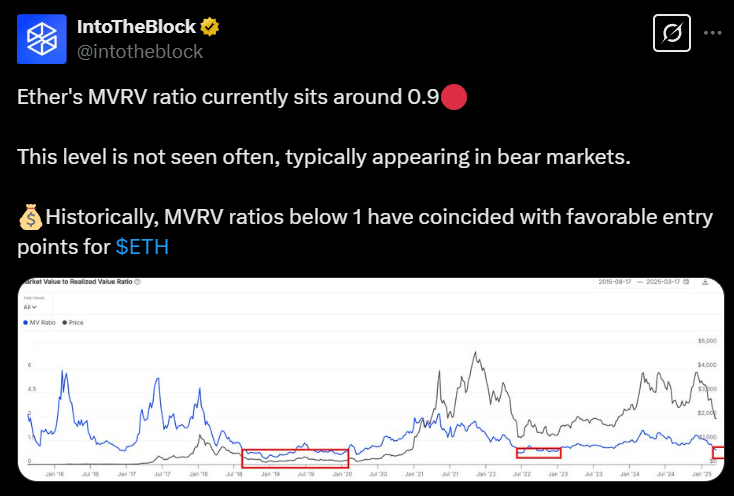
Source: IntoTheBlock’s X
A ratio below 1.0 has historically signaled that Ethereum is undervalued. Previous occurrences of such levels have coincided with bear market bottoms. What does this mean?
Ethereum’s MVRV ratio dropped 30% from 1.32 in February, mirroring past market corrections in 2018, 2020, and 2022 – Periods that have preceded recoveries on the price charts.
Capitulation or a hidden accumulation play?
Another key metric, the Spent Output Profit Ratio (SOPR), added further insights into investor behavior.
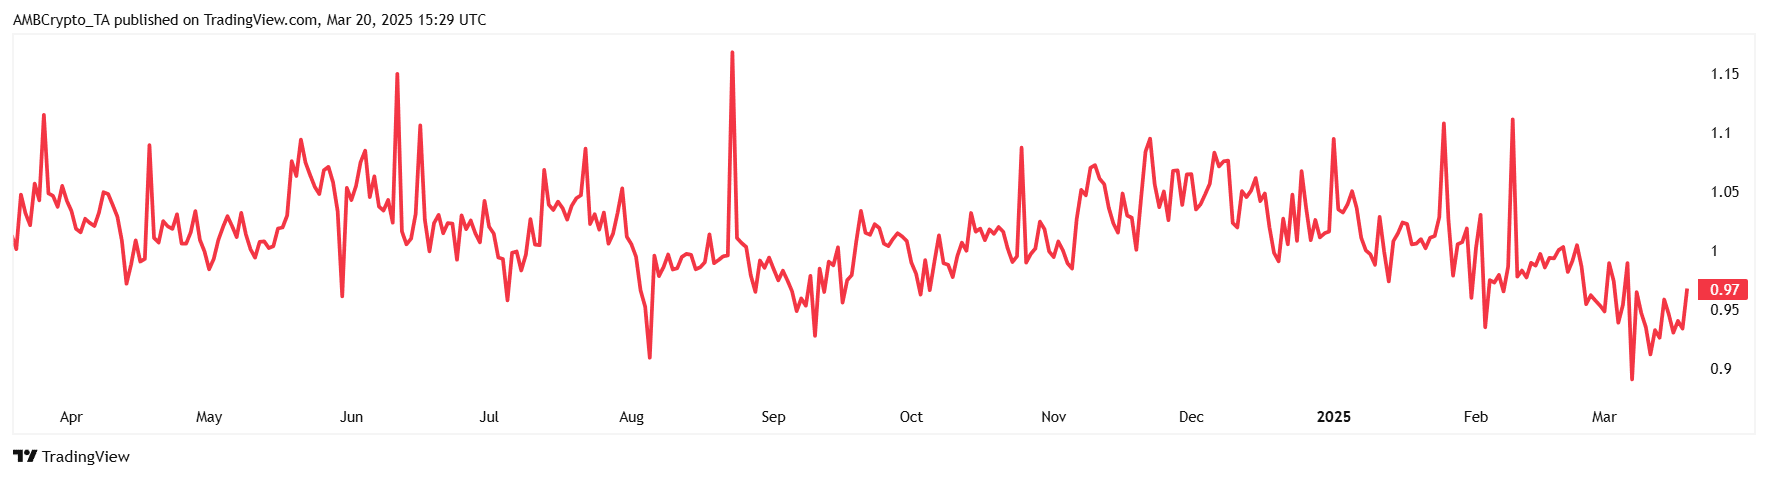
Source: TradingView
At the time of writing, the SOPR sat at 0.97, signaling that most ETH trades were at a loss – A common capitulation sign. When SOPR falls below 1.0, it has often been marked by local market bottoms as selling pressure begins to subside.
The decline in both metrics is a sign that Ethereum may be near a local bottom – Historically, an accumulation phase before recovery.
Ethereum at a crossroads
Ethereum’s market conditions present two possible outcomes.
Falling trading volumes and network activity point to weak demand, potentially dragging prices lower. However, with the MVRV and SOPR at historically low levels—previously seen before major rebounds—this could also be an accumulation phase.
Whether the market sees further losses or a recovery depends on how investors react to the data.


