
- The large size of the Options expiry on 16 August was preceded by a volatility spike in prices
- Price trends could stabilize from here on, but the bears still have the upper hand
Data on the Bitcoin [BTC] and Ethereum [ETH] Options expiry on Friday, 16 August, is illuminating. On Wednesday, 14 August, BTC prices fell from $61.8k to $57.9k within just a day.
Owing to the Options expiry, one can see the market price trends stabilize somewhat. Even so, the technical indicators and liquidity charts revealed that a move south might be likely.
Market outlook from the Options expiry data
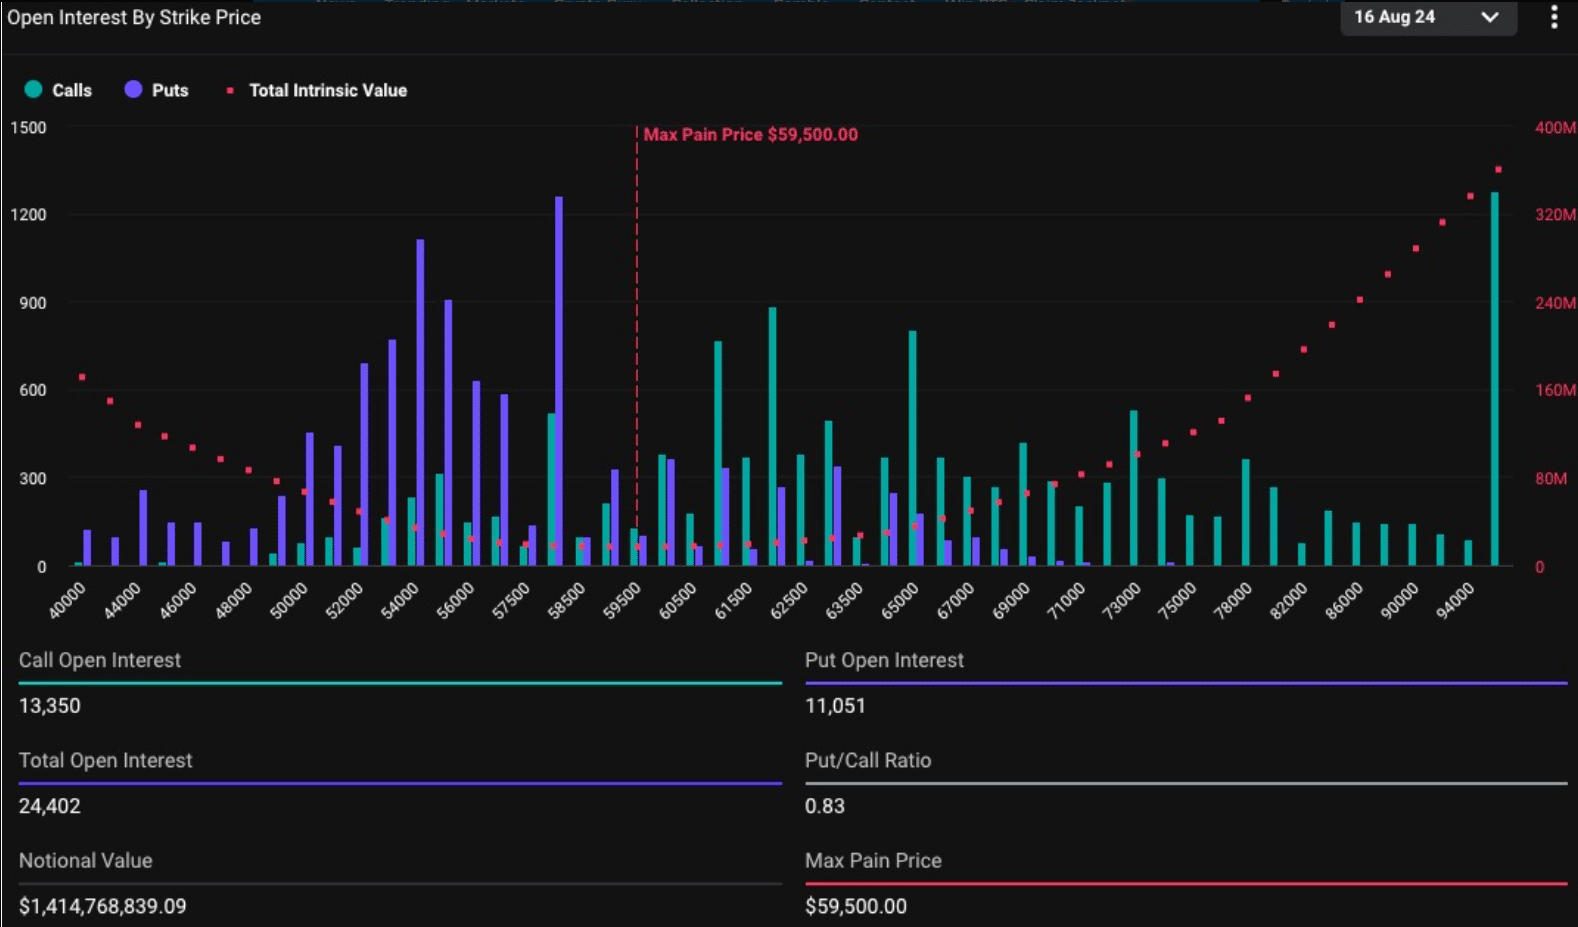
Source: Deribit
Data from Deribit (via Coingape) revealed that the market outlook for both Bitcoin and Ethereum favored the bearish side. For BTC, the notional value of the total Open Interest stood at $1.414 billion before the expiry on Friday.
The 0.83 put/call ratio showed that the market sentiment was slightly bullish, but leaned toward a balanced market sentiment. The max pain point was at $59.5k, underlining the place where most Options would expire worthless.
The Thursday price dip below $58.5k was not reversed.
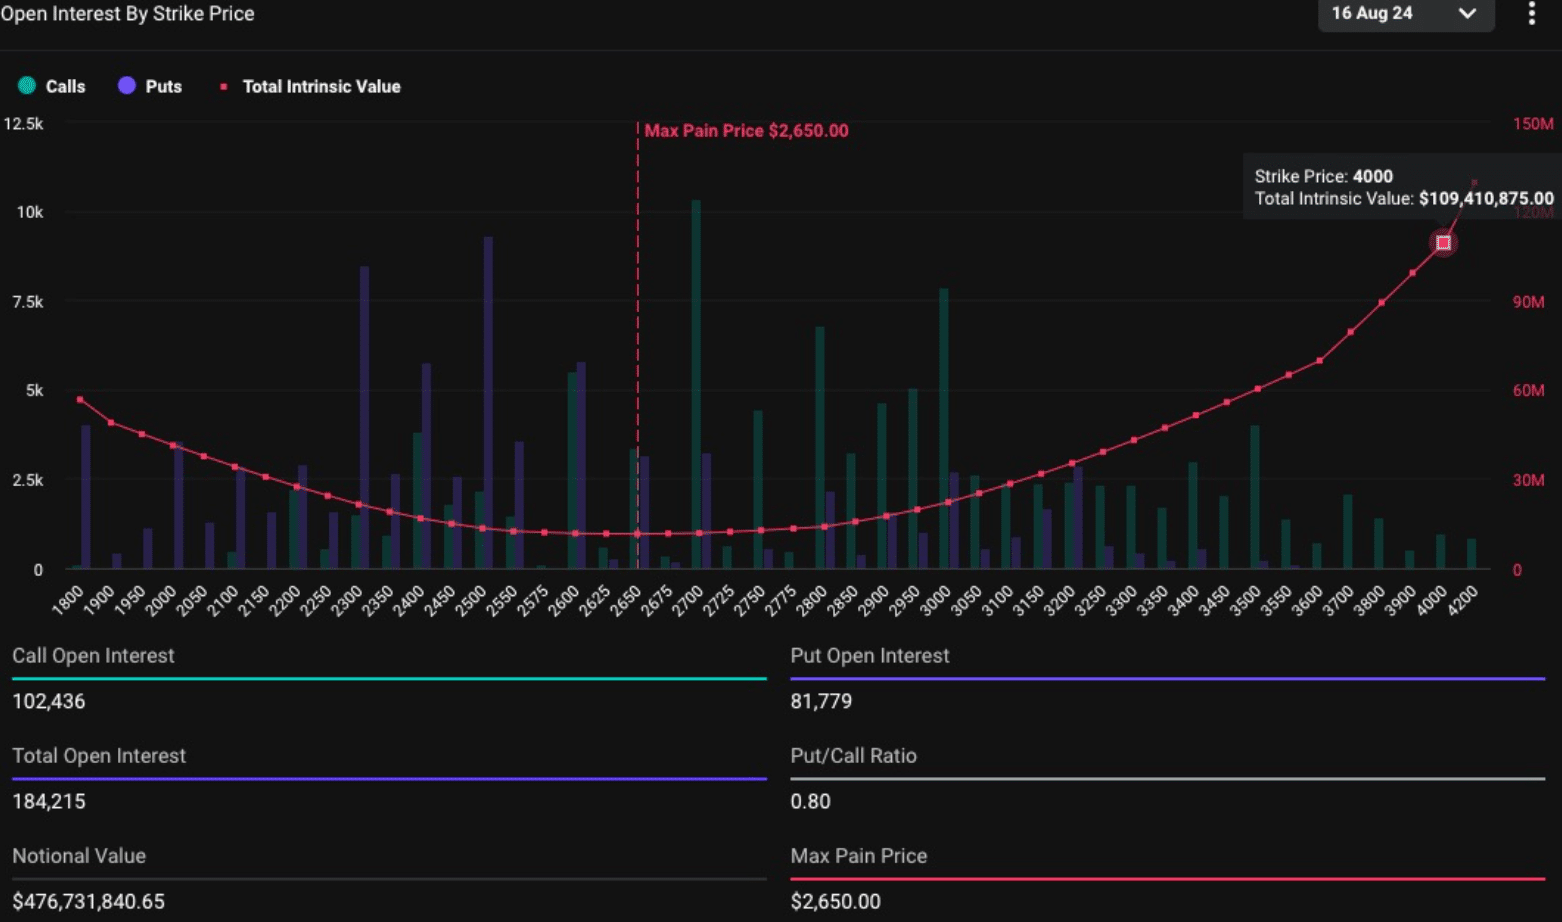
Source: Deribit
The Ethereum Options expiry amounted to $476.7 million, and the similar put/call ratio to BTC’s meant the market was only slightly bullish. ETH remained below $2610, with the max pain point at $2650.
BTC and ETH were up 0.8% and 0.4% on Friday, respectively, at press time after the massive Options expiry, which introduced volatility and a small price slump in the late hours of Thursday.
What next for the crypto markets?
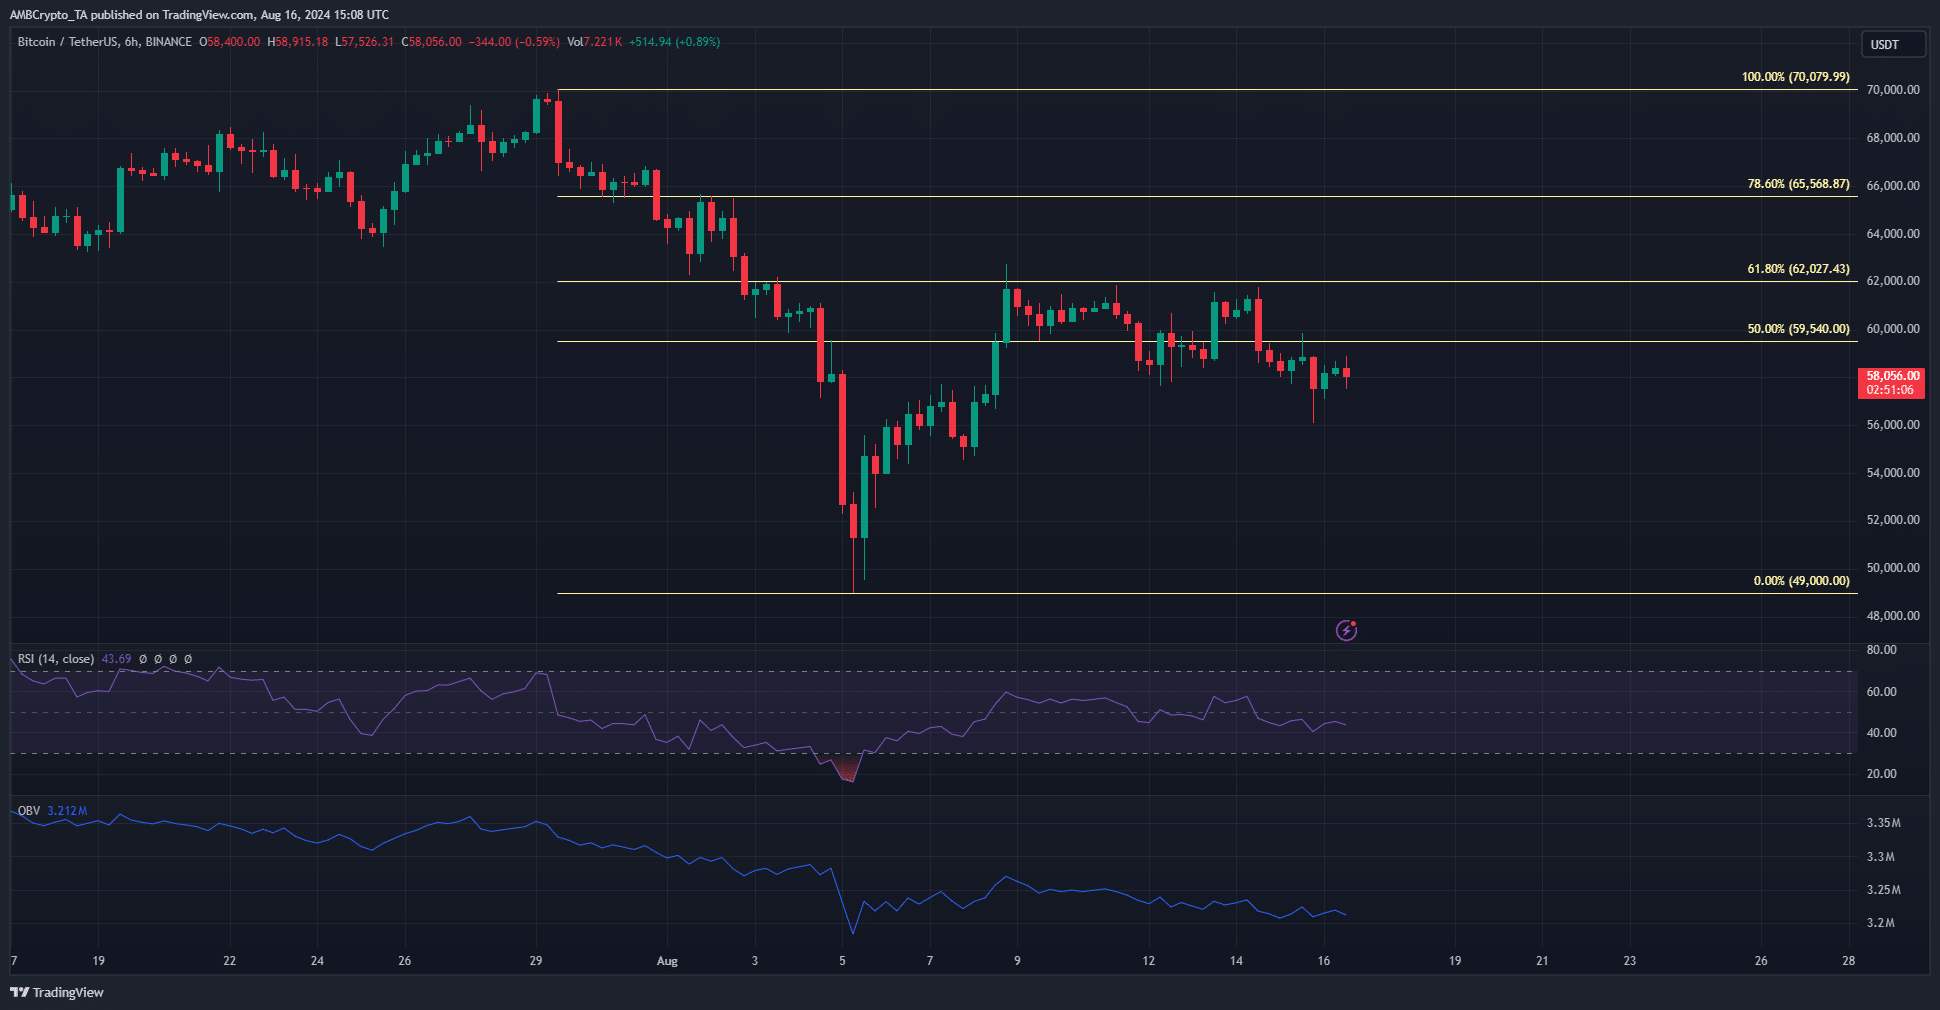
Source: BTC/USDT on TradingView
The next expectation is that the volatility would ease, but the trends for both the leaders remain bearish. Bitcoin has a bearish market structure and the OBV showed persistent selling pressure on the 6-hour chart.
The lack of upward momentum agreed with the structure and did not promise a reversal. Ethereum seemed to have a similar bearish outlook too.
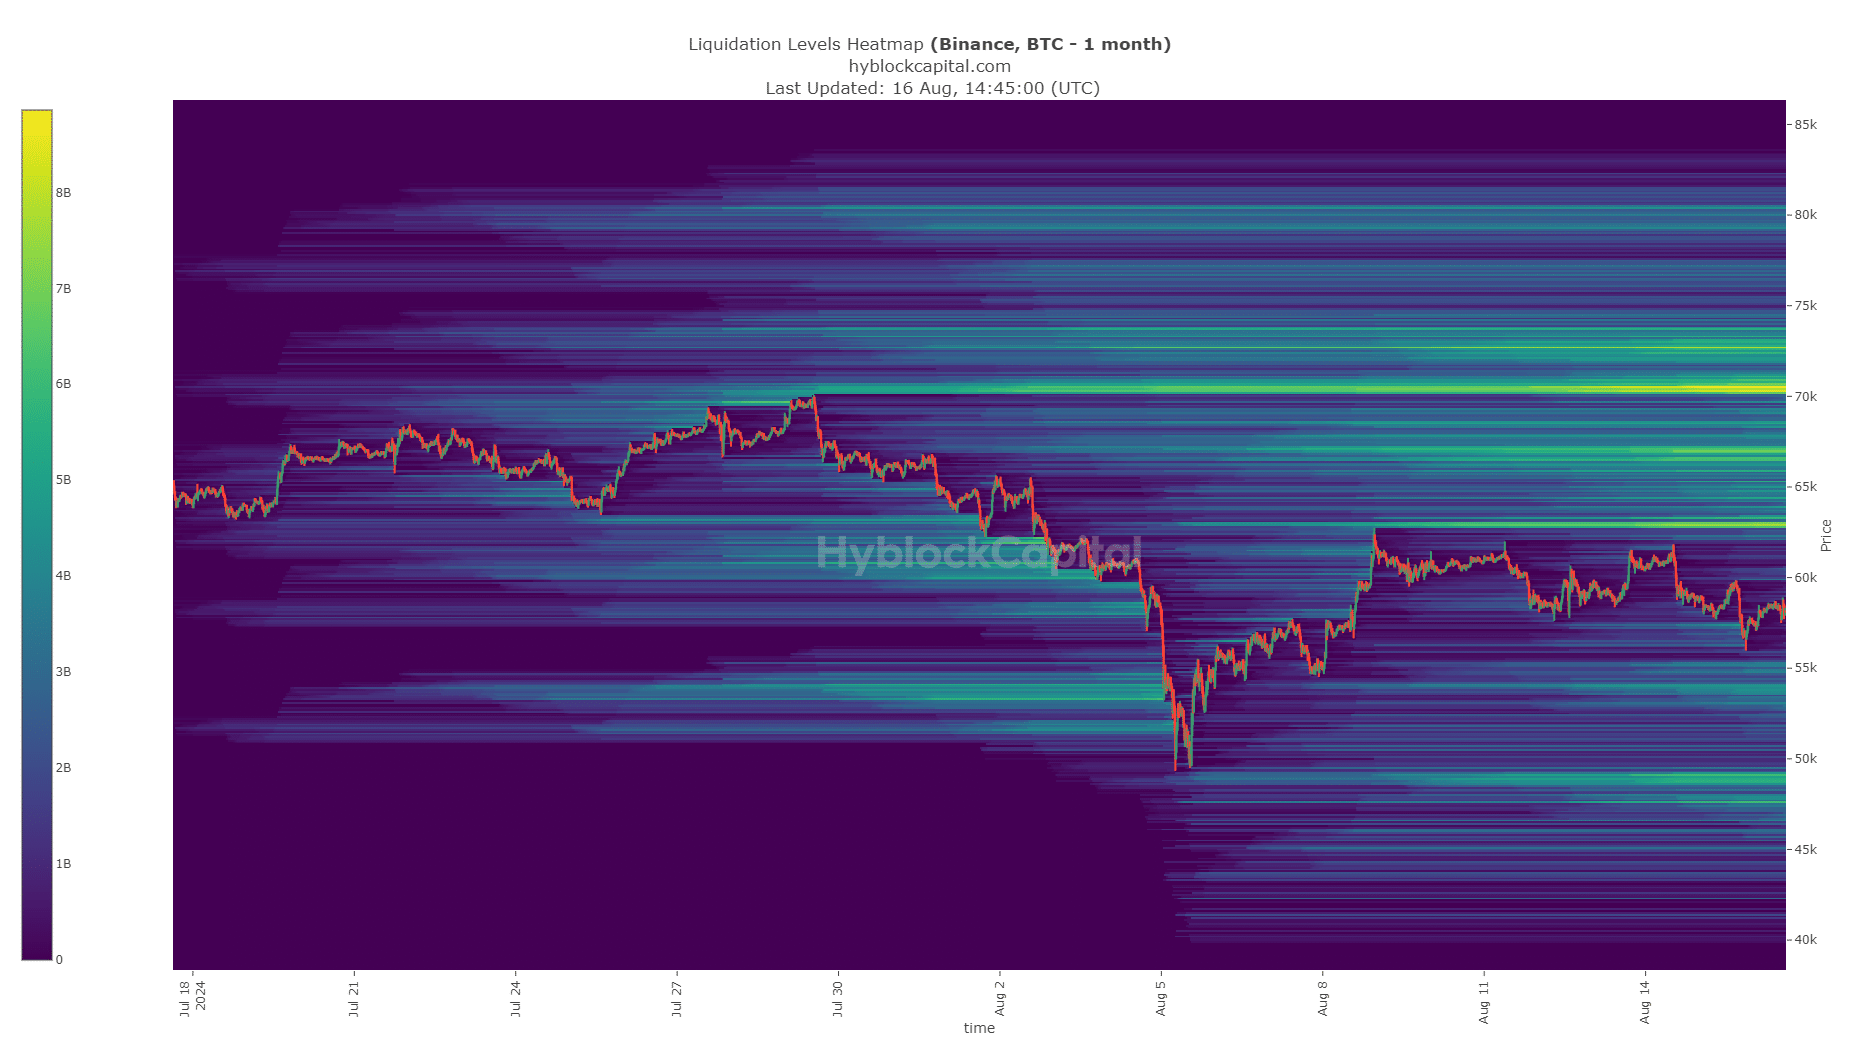
Source: Hyblock
In fact, the liquidation heatmaps showed that downward targets were closer, and prices could gravitate toward them more easily.
For Bitcoin, the closest liquidity pool was at $55.1k, with a similar-sized one at $53.9k as well. To the north, the $70k zone, though full of liquidation levels, might not be reached soon.

Source: Hyblock
For Ethereum, the closest pocket was at $2.4k at press time. The upside target, though less likely, was at $2.8k-$2.9k. The CPI data showed a 0.2% month-on-month increase in July, but it was on par with market expectations.
Is your portfolio green? Check the Bitcoin [BTC] Price Prediction 2024-25
With the odds of a large Fed rate cut lowered, the technical, liquidity, and macro conditions all appeared to be in favor of the bears for the next month.