- LTC seemed to be testing the support at the bottom of a triangle pattern
- Short-term bullish sentiment seen thanks to the 50-day MA above longer MAs and the price trading above the Ichimoku Cloud
Litecoin (LTC), at press time, was testing the support at the bottom of a triangle pattern, raising concerns about a potential drop to $70. As the community watches closely, the question on everyone’s mind remains – Is LTC more likely to surge above $90, or will it face a decline to $70?
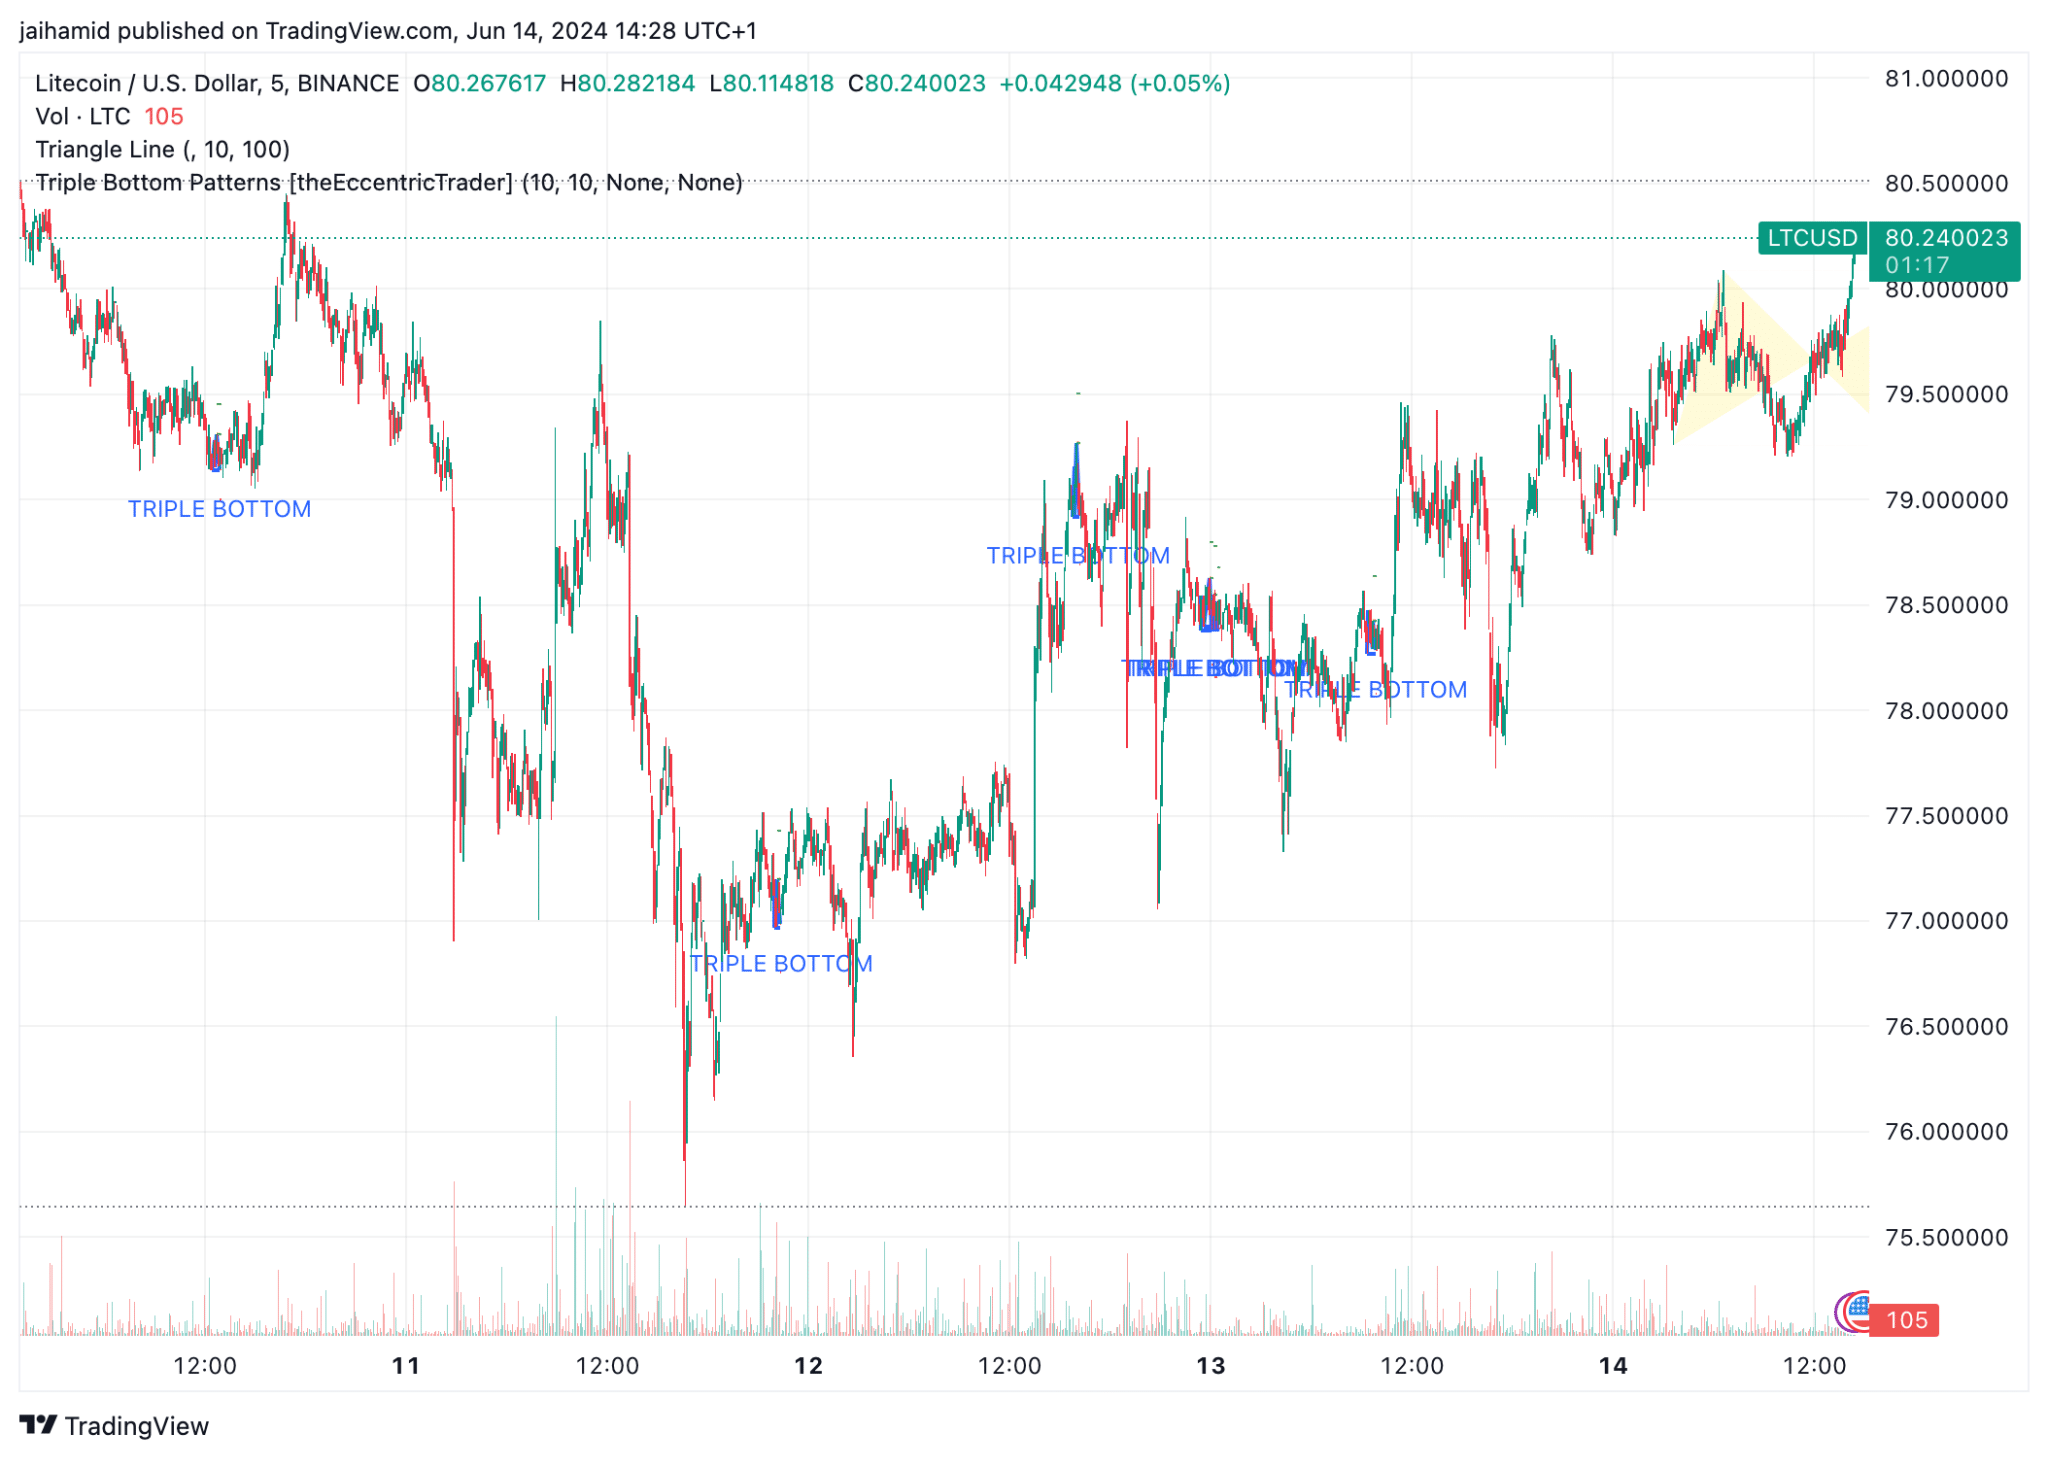
Source: LTC/USD, TradingView
For its part, LTC has seen several triple-bottom patterns over the past five days, particularly around lower price points. This pattern generally suggests a bullish reversal, which means there is huge potential for price increases if the bottoms hold firmly.
The upper band of the triangle pattern, along with the resistance near the $80-mark, needs to be watched. A decisive breakout above this level could signal a move towards higher resistance, possibly around the $90-mark or even higher.
As can be seen on the chart, Litecoin, at press time, was testing the lower support level of the triangle pattern. If this level fails, a drop towards $70 could occur, especially if the support gives way under selling/bearish pressure.
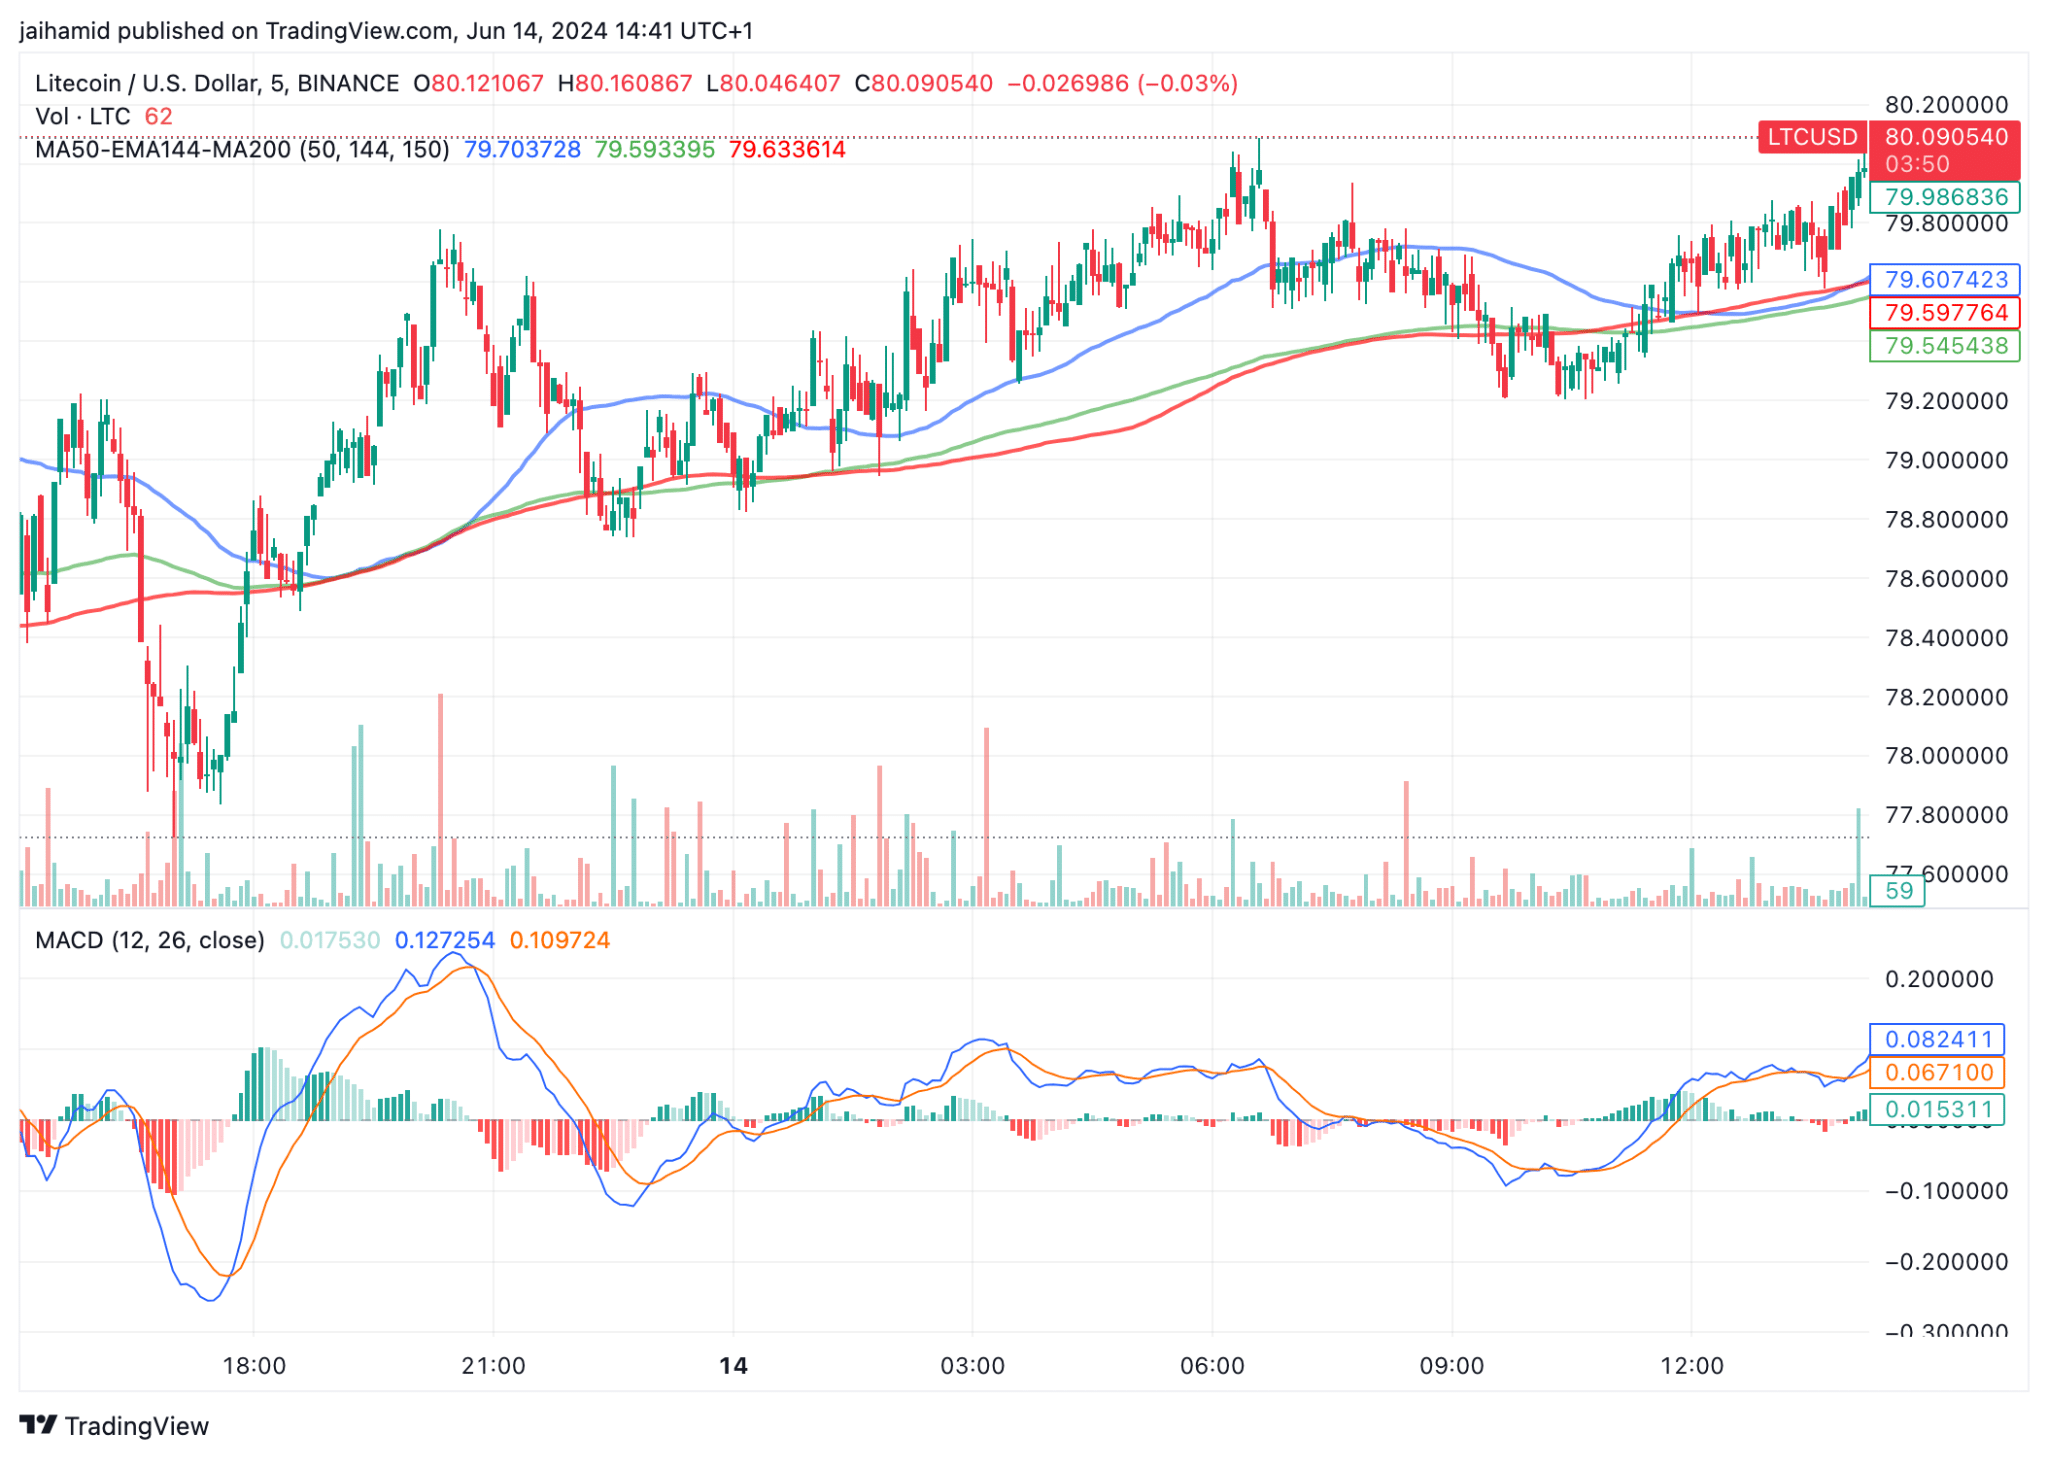
Source: LTC/USD, TradingView
The 50-day moving average (blue line) seemed to be positioned above the 144-day exponential moving average (green line) and the 200-day moving average (red line – A sign suggesting there might be some bullish sentiment in the short term.
However, all three lines were relatively close together on the charts, indicating a consolidation phase with no significant momentum in either direction.
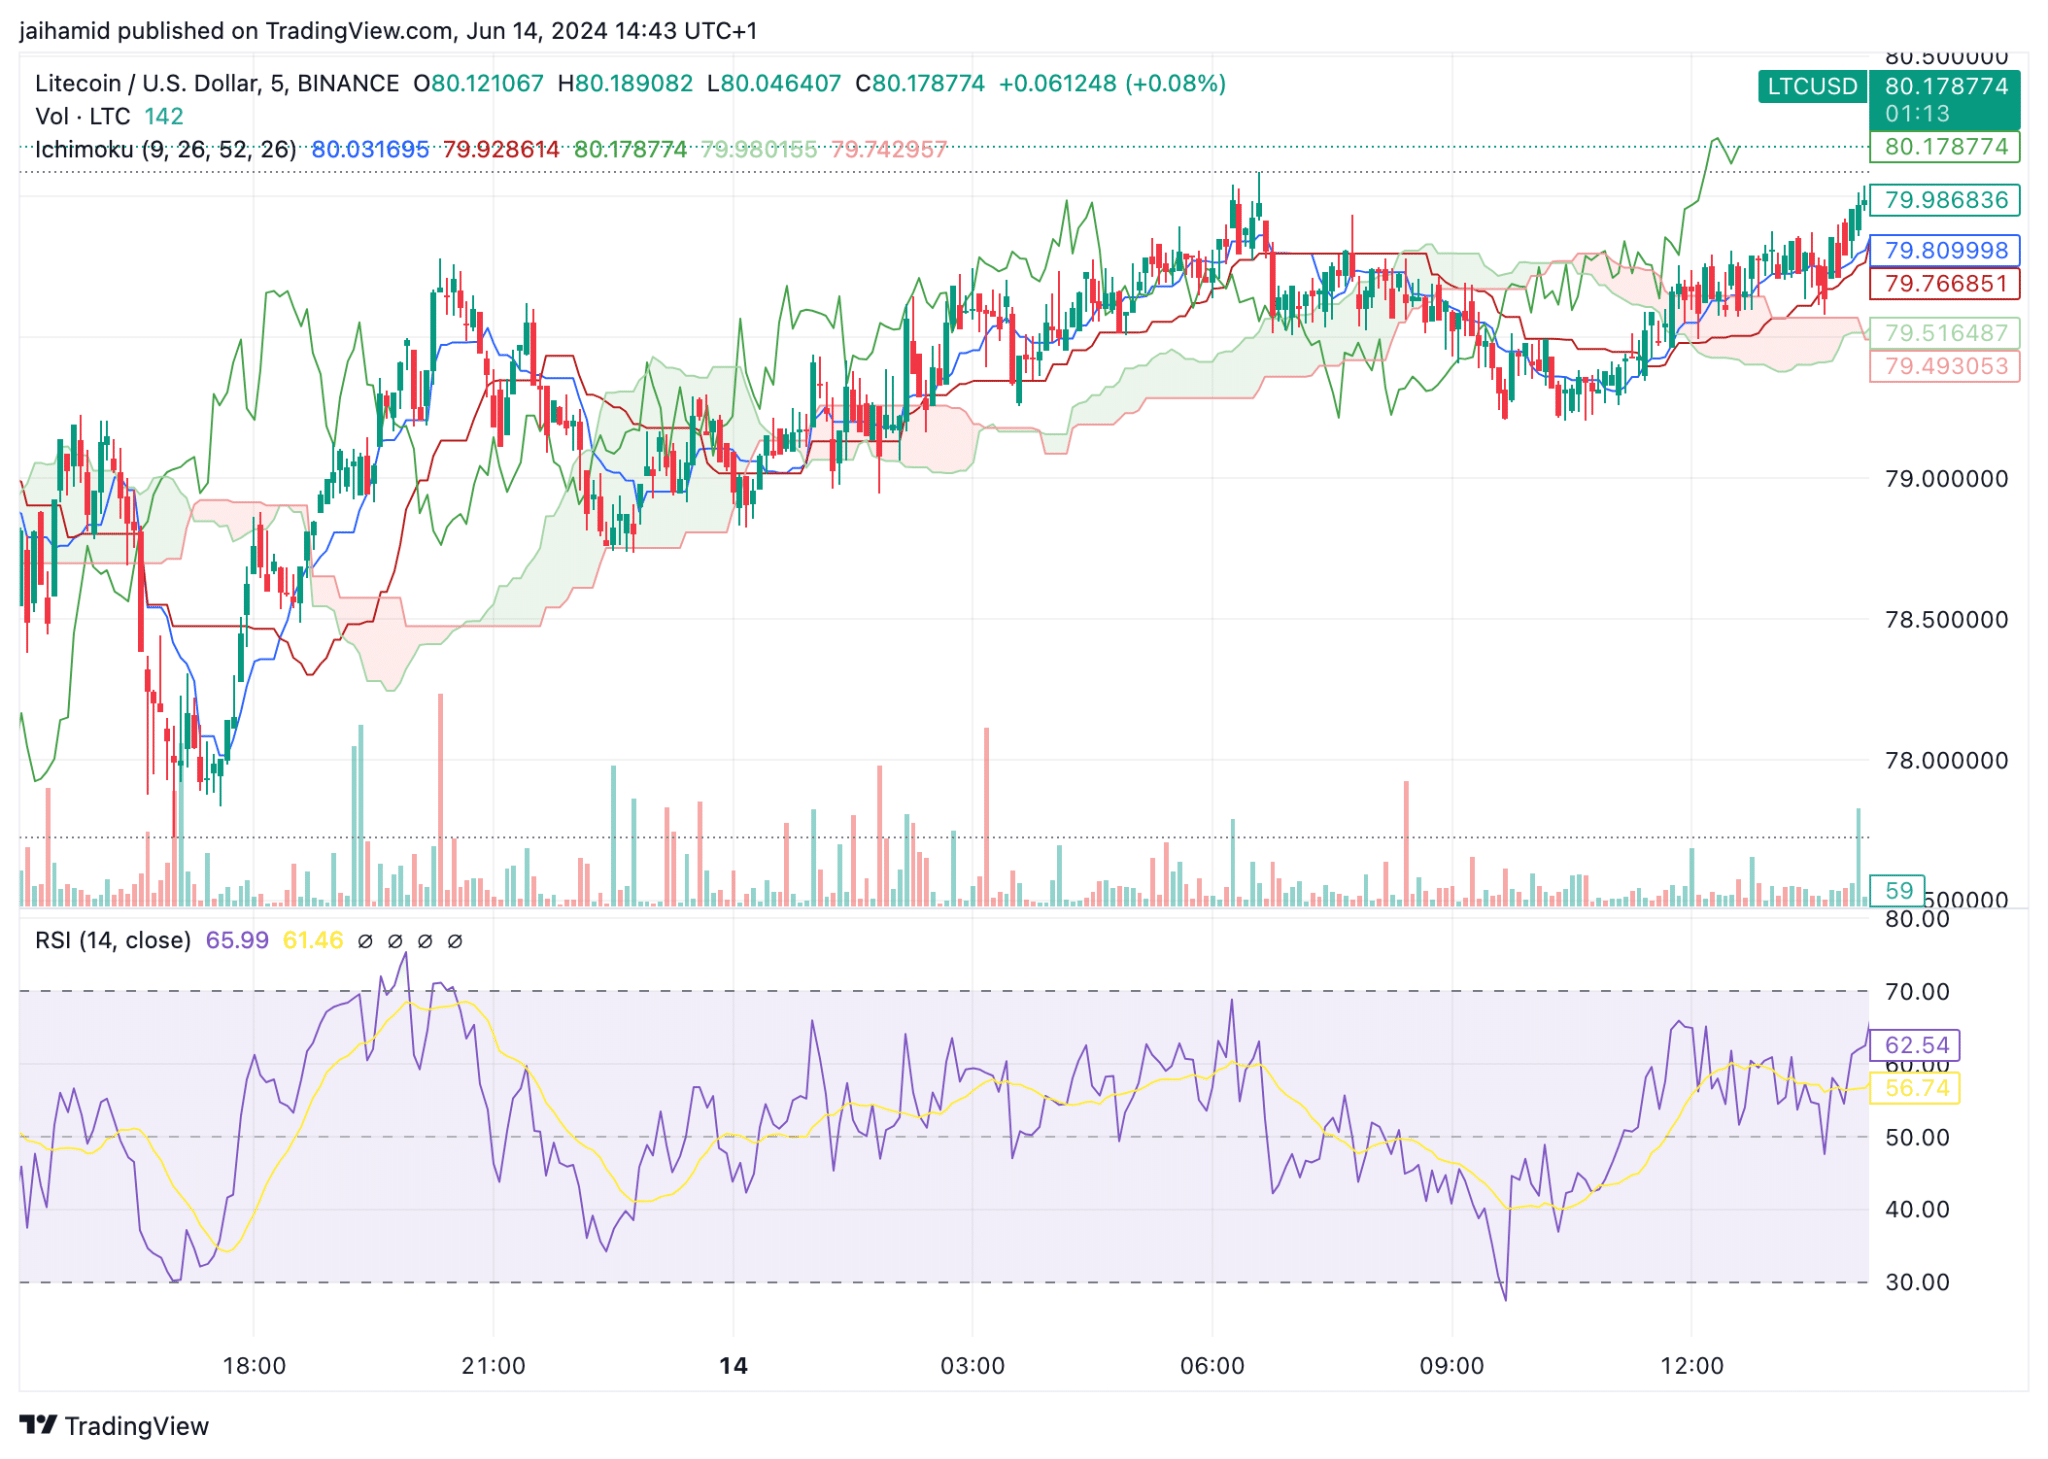
Source: LTC/USD, TradingView
Additionally, the price seemed to be trading above the Ichimoku Cloud too, which typically indicates a bullish trend. In such cases, the cloud mainly acts as a support zone.
The conversion line (blue) was above the baseline (red), reinforcing the bullish sentiment in the market. It also implied that short-term momentum may be stronger than the longer-term momentum.
Finally, the RSI was around 66 – On the higher side, but still below the overbought threshold of 70. Simply put, Litecoin’s market may have strong buying pressure but not necessarily overbought conditions. Ergo, there may be room for further upside before the market gets overheated.