Assessing the odds of XRP’s price dropping by another 5% on the charts
Hike in sell volume on XRP could see the $2-level slip out of the bulls' control.

- XRP bulls have defended the $2 support well over the past month and could do so again
- Rising sell pressure over the past week could push the price down by more than just 5%
XRP, at the time of writing, seemed to be flashing some mixed signals on its price charts. It appeared likely to test the $2 support level and bounce higher. However, over the past four days, the selling pressure has picked up pace. Also, the legal victory did not quite help the altcoin’s bullish case.
Also, Bitcoin [BTC] was about the test the $83k support at press time. If BTC can bounce higher, XRP would likely follow. Therefore, traders should monitor both XRP and BTC trends to gauge if a bullish reversal is imminent or not.
XRP traders can look to go long but should watch out for these levels
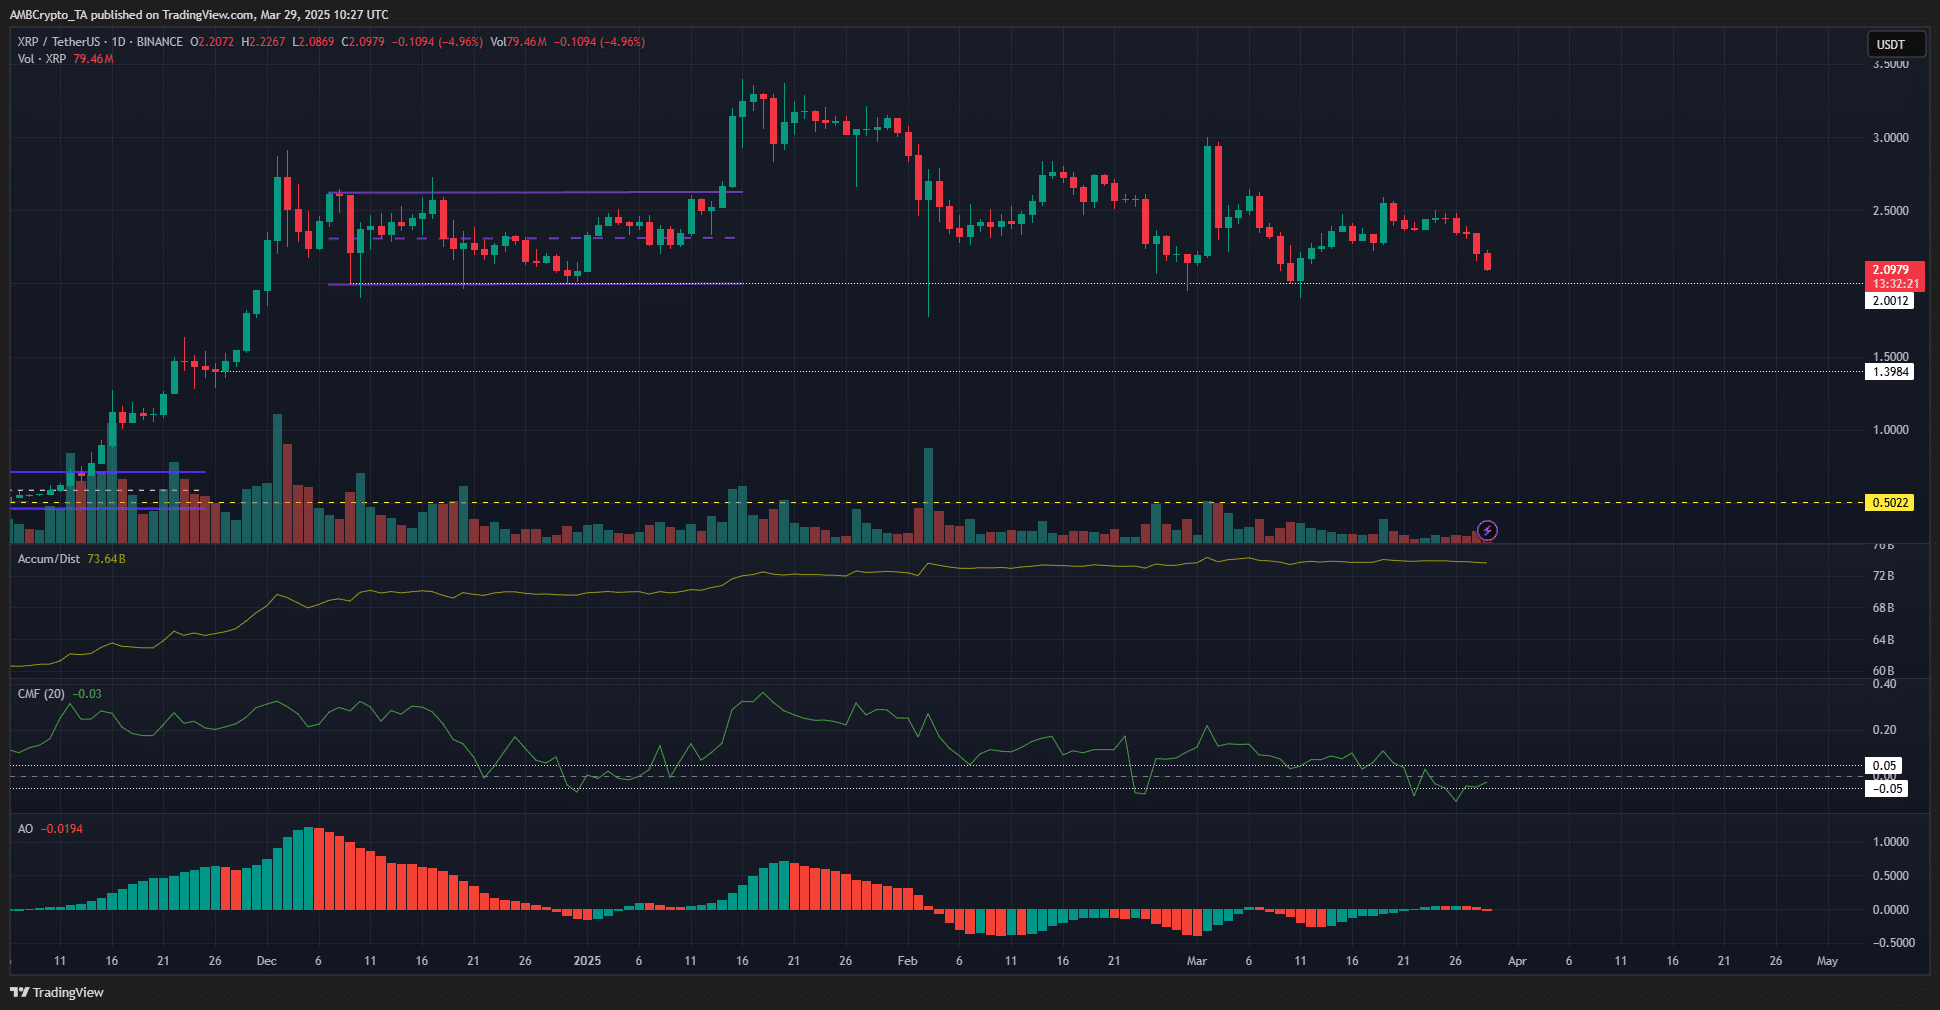
In December, XRP formed a range between $2 and $2.5. Over the past month, the price has reverted to the same support level at $2. The sellers were unable to break this demand zone and force the prices lower.
This was likely because of a lack of overwhelming seller superiority. The CMF has not fallen below -0.05 noticeably in the last three months. And yet, over the last ten days, it has begun to trend lower. This signified a lack of heavy capital flow out of the market until recently. And even then, the trend was not sustained.
On the other hand, the A/D indicator maintained itself at levels from early March. It can be seen as another sign of a lack of dominant selling pressure. However, it also showed that buyers were hesitant. This was apparent from the Awesome Oscillator, which showed a lack of trend and prevalent momentum.
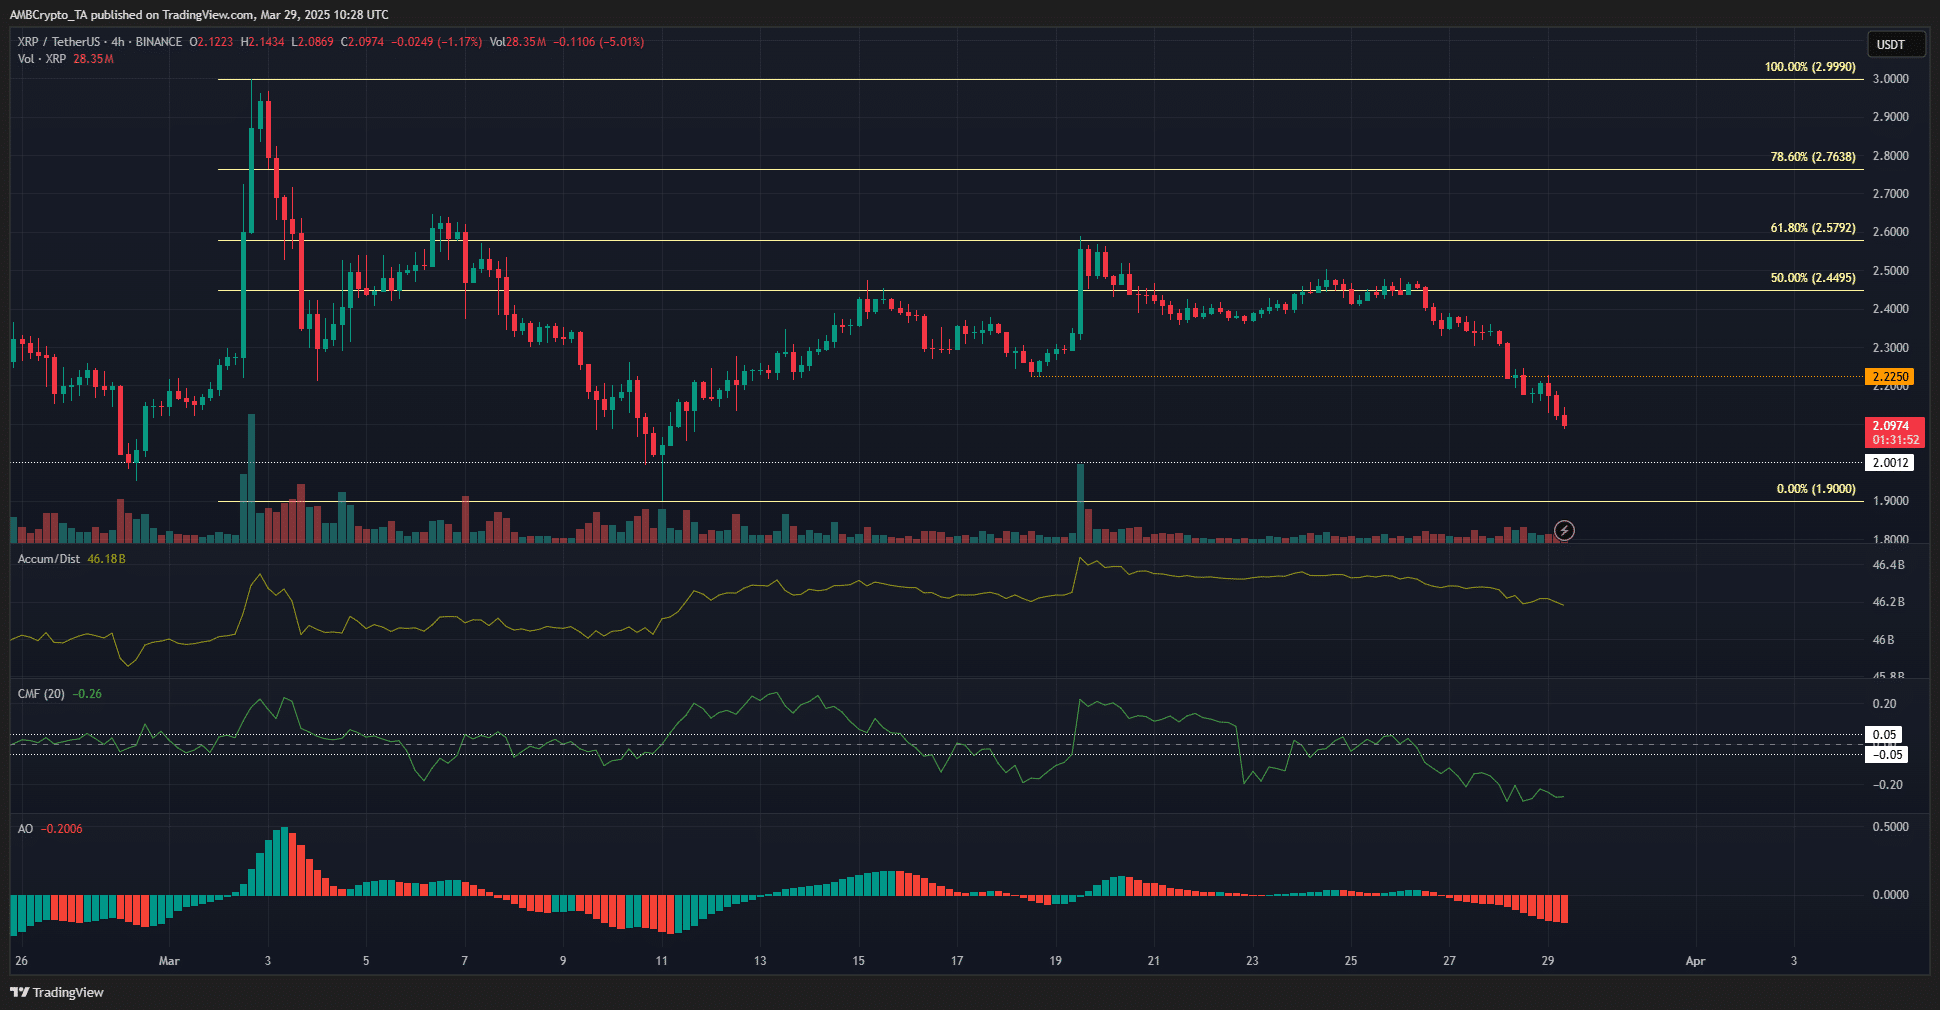
These confusing signals on the 1-day chart resolved into bearish ones on the 4-hour chart. The A/D was trending slowly south, the CMF was below -0.05, and the Awesome Oscillator formed red bars on the histogram.
Together, they underlined a hike in selling pressure over the past week. XRP aslo fell below the short-term support at $2.225. This was a clue that a move to $2 may be likely next – Another 5% drop.
Whether XRP’s price can recover from here is uncertain. In fact, the daily chart showed that $2 would likely be defended once again. At the same time, the bulls have little say in the market right now, with the overall market sentiment firmly bearish too.
Buyers should be cautious, but going long could provide profits. Risk must be managed carefully. A drop below $1.95 would invalidate the idea of a price bounce from $2, and traders can then lean bearishly.
Disclaimer: The information presented does not constitute financial, investment, trading, or other types of advice and is solely the writer’s opinion