
- Bitcoin might be nearing a key liquidity zone around $86k, where 77% of liquidation levels are long
- A classic setup could be forming where overcrowded positions are exploited before a potential reversal
Let’s take a step back to examine Bitcoin’s weekly structure. The high-FUD sentiment that weighed on its recent price action might be easing, with BTC consistently closing daily candles at an average of $82.60k – A sign of underlying bid strength.
Notably, the Relative Strength Index (RSI) seemed to be below overheated levels, suggesting that momentum still has room to expand without triggering immediate profit-taking.
Supporting this bullish undercurrent, all exchanges recorded net outflows of 35,758 BTC on 11 April, at a price of $83,403 per BTC – A textbook signal of strategic accumulation.
Together, these signals allude to the emergence of a potential bottom formation. One where an increasingly solid demand wall may absorb sell-side pressure and cap downside risk. At least theoretically.
However, from a liquidity standpoint, the picture might be less reassuring. A significant liquidity cluster has been forming above press time price levels. According to AMBCrypto’s analysis, this could create a high-risk setup for a downside liquidity sweep.
In short, is this setting the stage for a bull trap?
Market makers set to exploit overcrowded long positions
At press time, Bitcoin was closing in on a key liquidity zone near $86.50k. However, there seemed to be signs of weakness underneath.
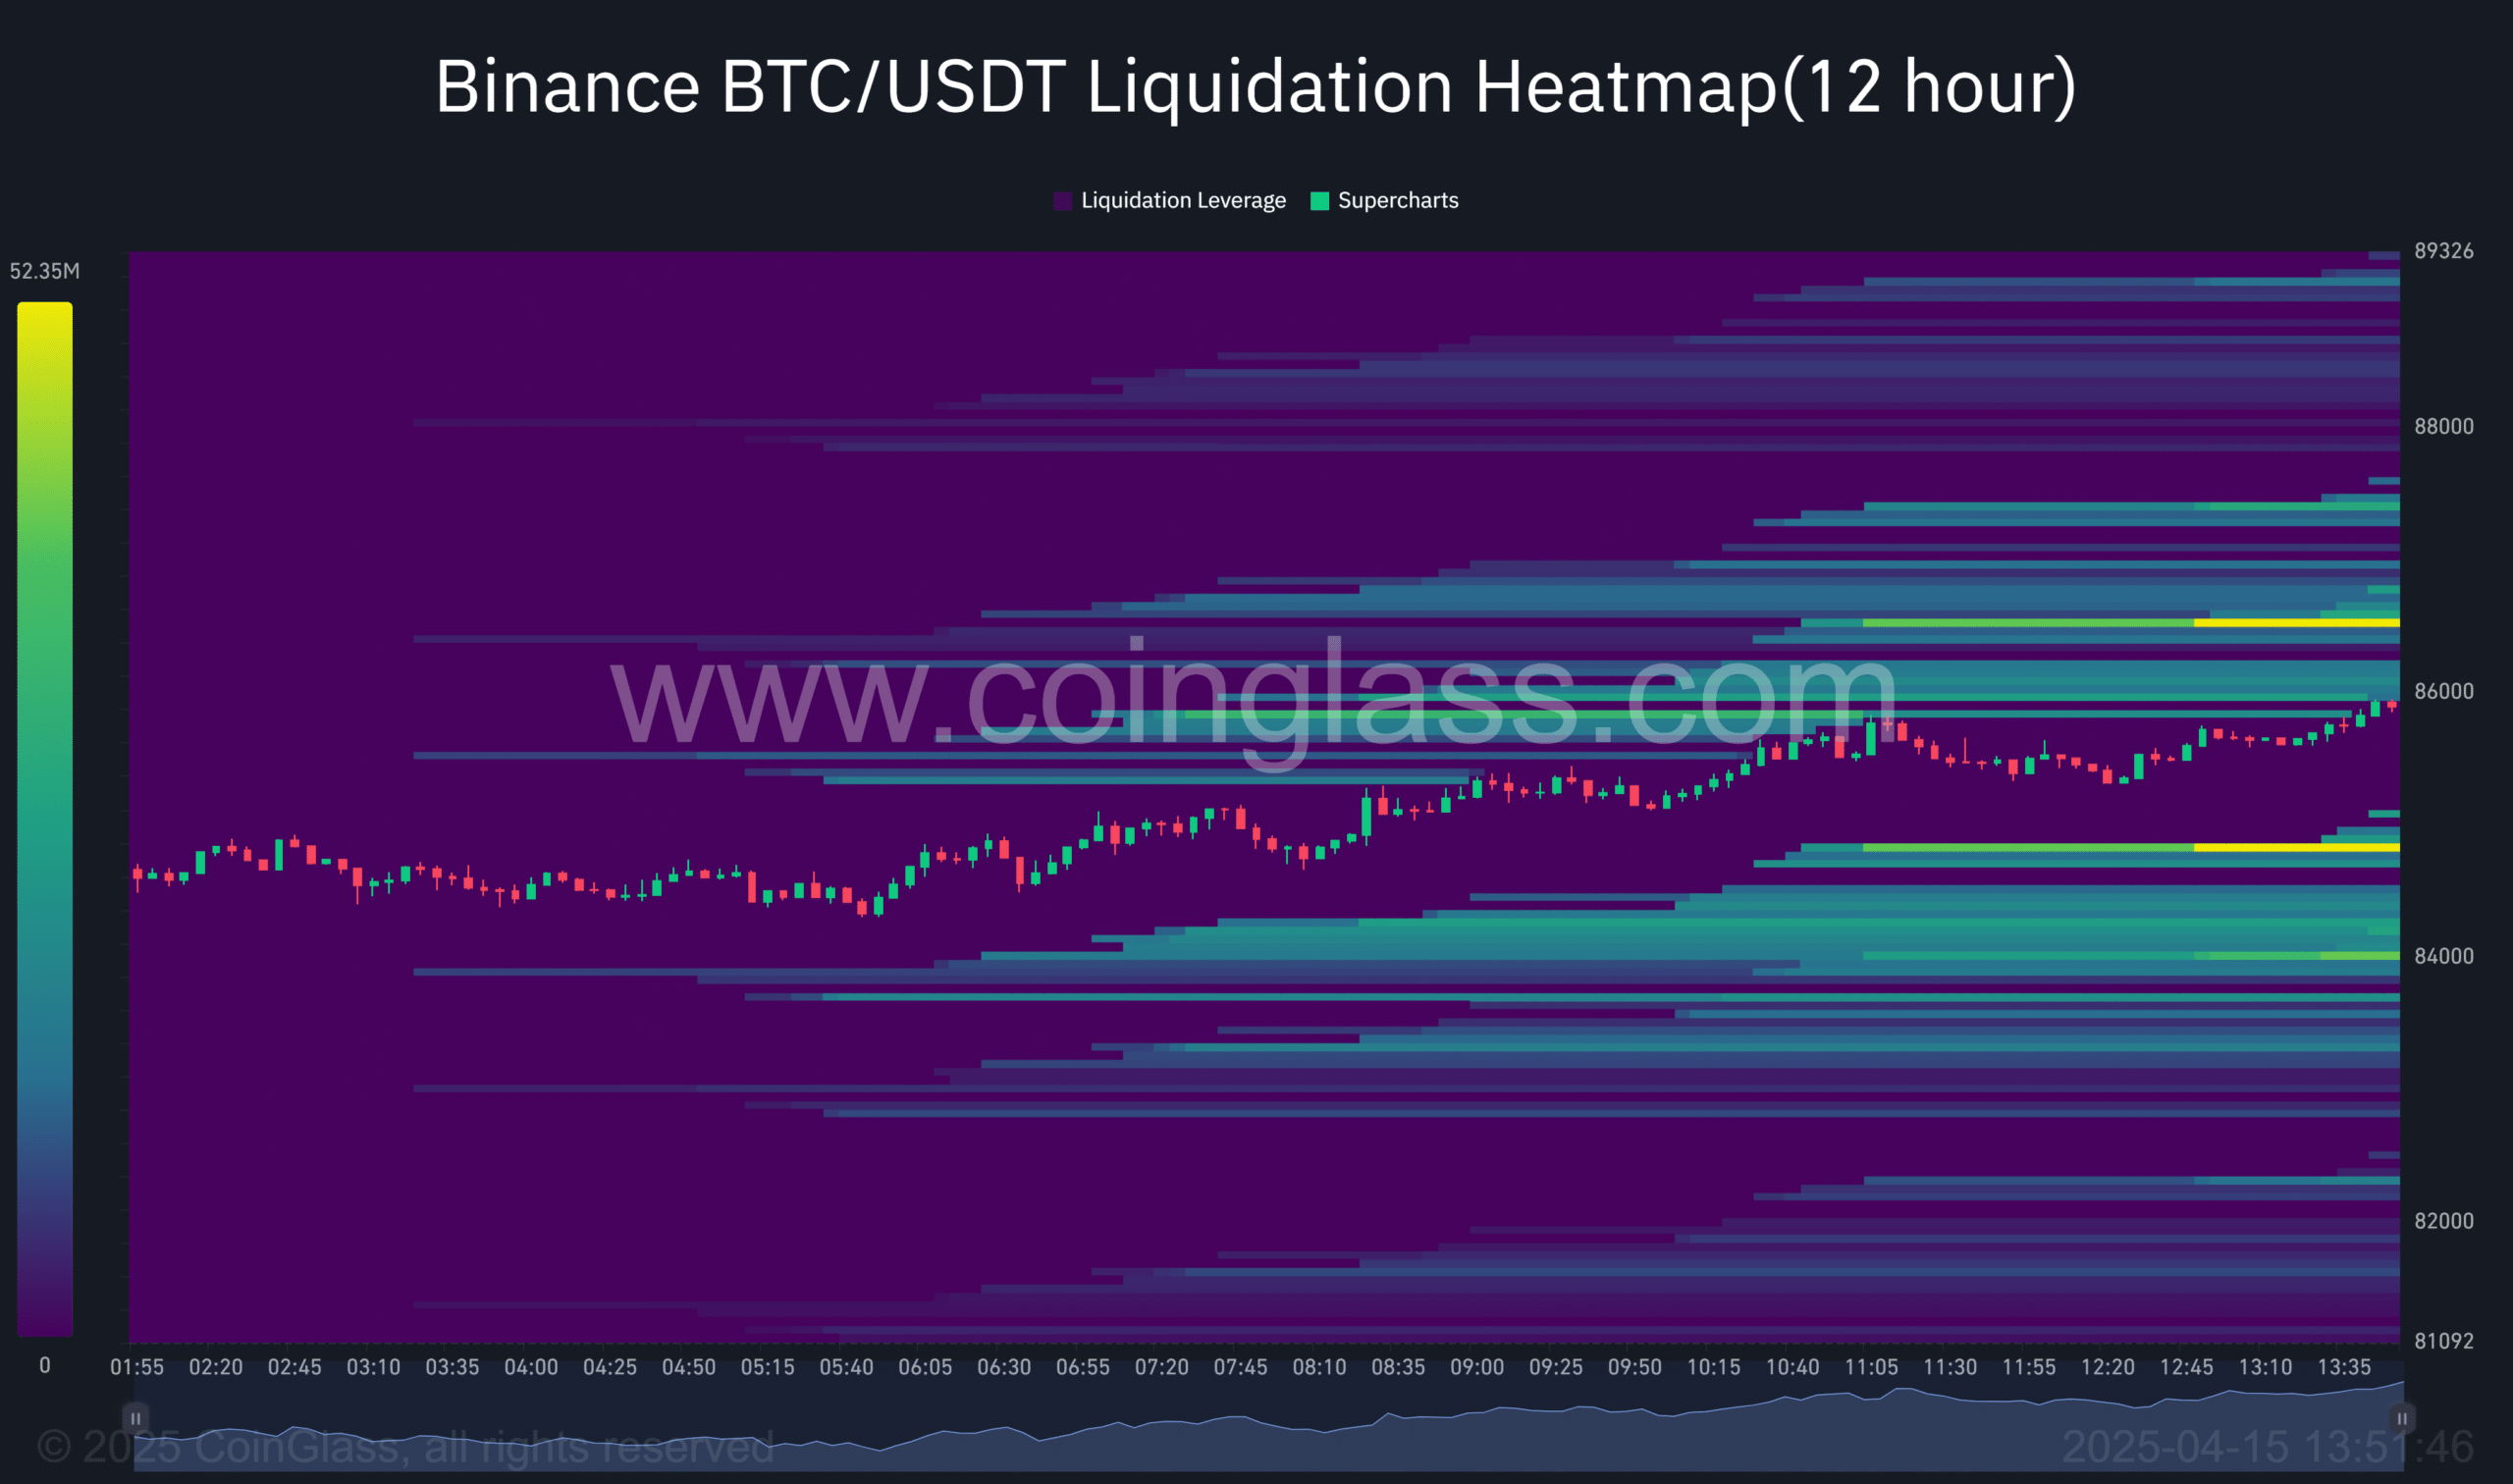
Source: Coinglass
The retail long positioning has been relatively low, with bid-ask ratios in the negative to signal fading demand. Additionally, the flat Open Interest (OI) indicated a lack of fresh capital inflows to support the move.
More crucially, 77% of liquidation levels clustered around this liquidity zone were long positions. Consequently, this liquidity cluster could act as a magnet, potentially triggering a downside sweep as market makers capitalize on forced liquidations.
In fact, this level also represents the Alpha Price zone, a key area that has historically acted as both support and resistance. There’s a risk Bitcoin might briefly go above this level, only to fall back down – Setting up a bull trap.
Bitcoin needs real conviction-backed hard data
The NUPL (Net Unrealized Profit/Loss) metric reveals the state of BTC’s current erratic price action.
Since 07 March, it has stayed within the ‘Optimism’ phase. This hinted that a significant portion of the market is in unrealized profit, with large holders likely accumulating.
However, every time BTC approaches the $86k–$87k zone, the NUPL shifts into ‘Anxiety’, showing that a growing number of market participants are starting to feel uneasy about their unrealized gains.
This shift suggests that profits, though not yet realized, are being pressured and could soon be taken off the table.
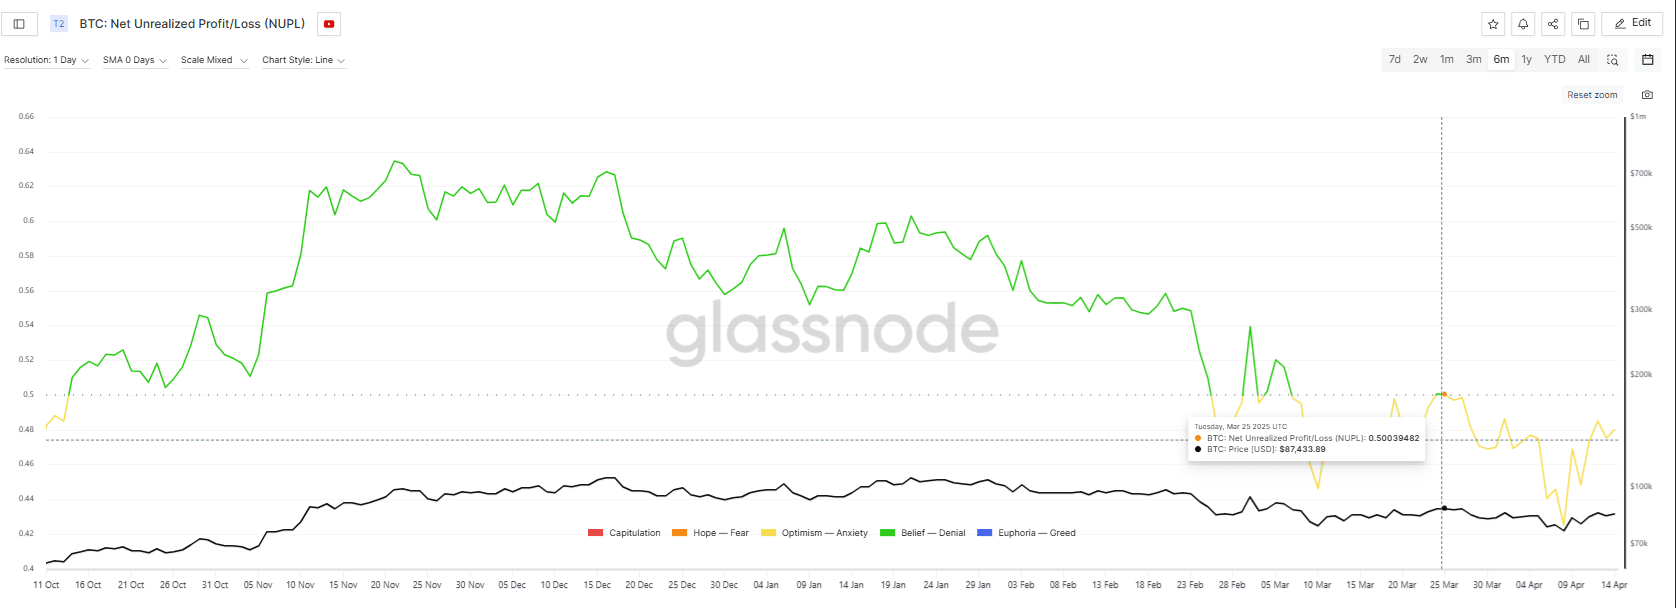
Source: Glassnode
For instance, on 25 March, Bitcoin briefly reclaimed $87.5k. However, before the NUPL could enter the Belief phase, it reversed into Anxiety. This pointed to market participants increasingly realizing or hedging against unrealized profits.
As Bitcoin revisits this zone, a similar pattern could drive the NUPL lower, signaling a shift in market sentiment.
As a result, with 77% of liquidations concentrated in long positions around this critical liquidity cluster, a downside sweep could be triggered. This would lead to forced liquidations, potentially driving BTC lower.
Unless Bitcoin decisively breaks out of this range-bound structure, the risk of further volatility and liquidation cascades remains elevated. This will leave the market vulnerable to a bearish leg.