- ATOM’s Daily Active Addresses and transactions dropped last week.
- Cosmos’s market indicators also looked bearish.
Cosmos [ATOM] was recently named the top crypto in terms of network activity. However, upon further digging, AMBCrypto found that there’s more to the story than what meets the eye.
Though network activity dropped, investors seemed to be enjoying profits, as ATOM’s price chart turned green.
Is Cosmos’s network activity up?
Cosmos Daily, a popular X (formerly Twitter) handle that posts updates related to the Cosmos ecosystem, noted that ATOM ranked number one on the list of cryptos in the IBC ecosystem, in terms of weekly active users.
Top #IBC Projects by Weekly Active Users 🔥
🥇 $ATOM @cosmoshub
🥈 $OSMO @osmosiszone
🥉 $TIA @CelestiaOrg$STRD @stride_zone$JUNO @JunoNetwork$STARS @StargazeZone$CRO @cronos_chain$KUJI @TeamKujira$EVMOS @EvmosOrg$AKT @akashnet_#Cosmos@MapOfZones pic.twitter.com/M234p0W5Wm— TKResearch Airdrop (@TKRAirdrop) December 23, 2023
At first glance, this indicated that ATOM witnessed a hike in users. However, upon further investigation, AMBCrypto found otherwise.
Our look at Artemis’ data revealed that ATOM’s Daily Active Addresses plummeted sharply over the last week. The same remained true for the blockchain’s Daily Transactions, which looked concerning.
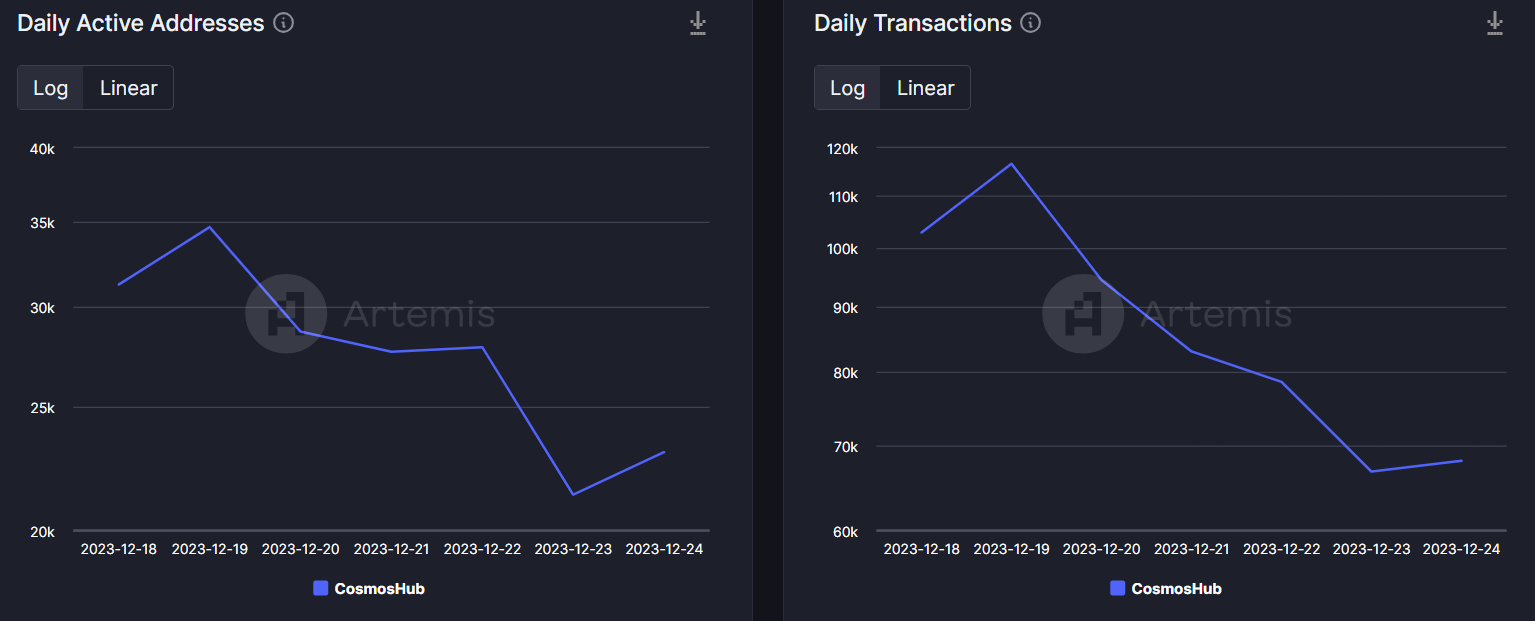
Cosmos’ fees and revenue sank during this same period. However, ATOM’s TVL registered growth, reflecting its improvement in the DeFi space.
How has ATOM been on the price front?
Though the blockchain’s network activity dropped last week, the same was not true for ATOM’s price action. According to CoinMarketCap, the token was up by 5% in the last seven days.
At the time of writing, the Cosmos was trading at $11.30 with a market capitalization of over $4.2 billion, making it the 20th largest crypto.
Since ATOM registered a promising performance, AMBCrypto checked the token’s on-chain metrics to better understand what was going on. Its social volume remained relatively high throughout the last week, reflecting its popularity.
Its MVRV ratio also spiked last week, which could have contributed to the hike in its price. However, while the token’s price rose, its development activity went sideways.


Read Cosmos’s [ATOM] Price Prediction 2023-24
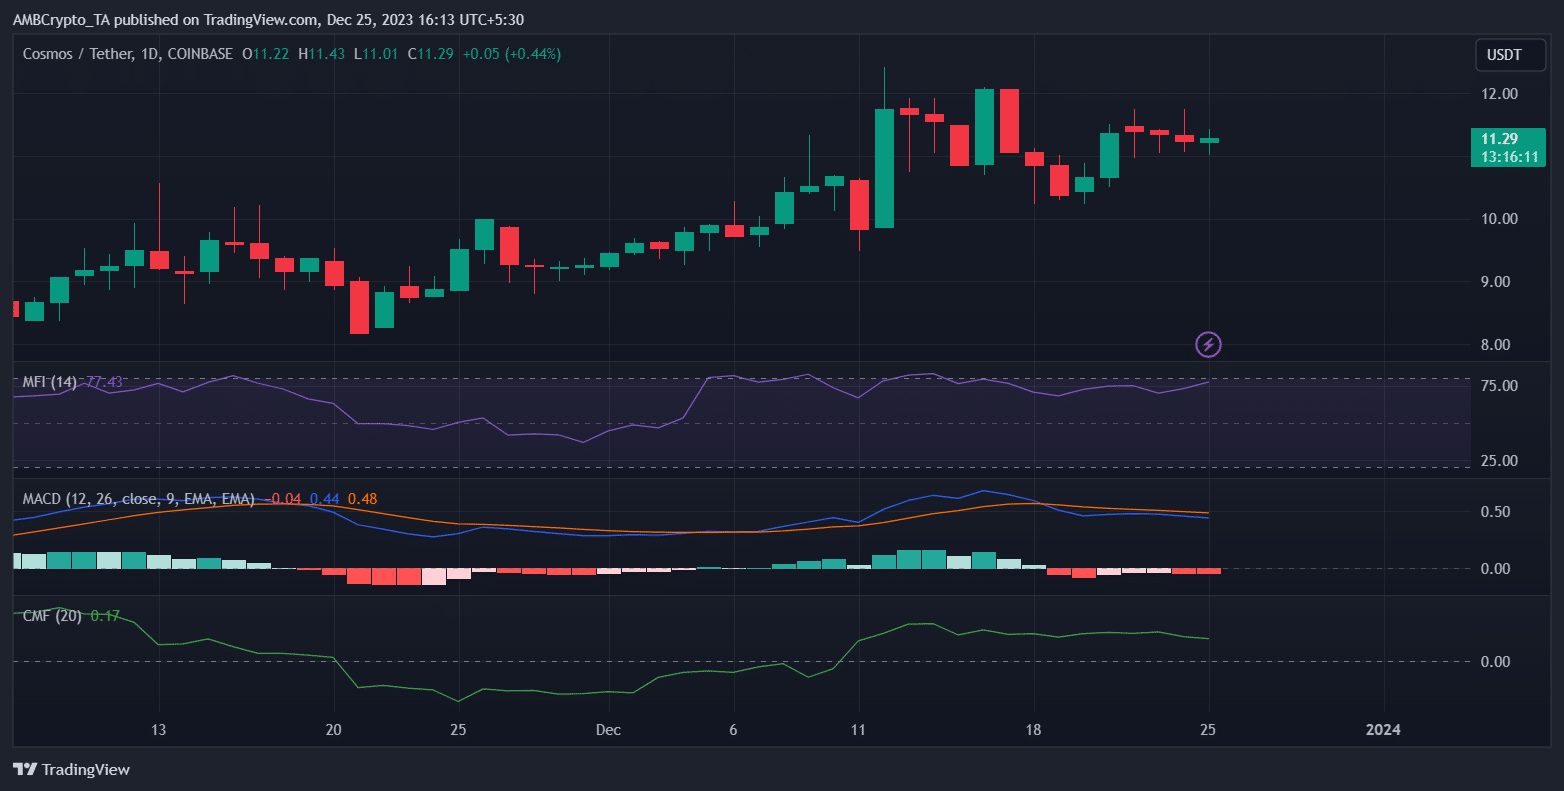
A look at ATOM’s daily chart revealed that the MACD displayed a bearish outlook in the market. Its Chaikin Money Flow (CMF) also registered a sideways movement, increasing the chances of a continued sideways price movement.
Nonetheless, the Money Flow Index (MFI) remained bullish as it took a northward path.