Attention MATIC holders! Here’s why another downtrend could commence
MATIC's MVRV ratio signaled that the altcoin was undervalued, but does not promise the prices will rally. In recent weeks, the dormant circulation metric saw multiple spikes that showcased sell pressure

Disclaimer: The information presented does not constitute financial, investment, trading, or other types of advice and is solely the writer’s opinion
- MATIC traded above a higher timeframe demand zone
- The rally to $0.87 and subsequent rejection showed the downtrend was likely to extend further southward
Polygon [MATIC] was trading just above a strong demand zone. The $0.5 support level has been defended well since June, but it was clear from the price action that the bulls were losing strength.
Read Polygon’s [MATIC] Price Prediction 2023-24
The rally to $0.87 in July was wiped out over the past two months and was a strong signal that the bears were out for blood. Evidence from the indicators supported the idea that MATIC was headed toward further losses.
The Fibonacci extension levels present bearish price targets for MATIC

The move down from $0.97 to $0.5 in late May and June was used to plot a set of Fibonacci retracement and extension levels (pale yellow). After the sharp downward move, MATIC rallied to the 78.6% retracement level at $0.87. A plunge to the $0.51 mark occurred after this rally.
This was a strong sign that the 23.6% and 61.8% Fib extension levels were the next targets. It is no guarantee that MATIC would drop that low but the price action and the indicators suggest it could.
The Relative Strength Index (RSI) on the three-day chart has been below neutral 50 since April to indicate a strong downtrend on the longer time horizons. The On-Balance Volume (OBV) has also been sliding lower since June, which denoted selling volume outweighed the buyers and the market was dominated by bears.
The $0.32-$0.5 was a bullish order block on the weekly timeframe. The 23.6% extension level at $0.4 was a reasonable bearish target in the coming weeks.
MATIC saw consistent development activity but also spikes in selling pressure in September
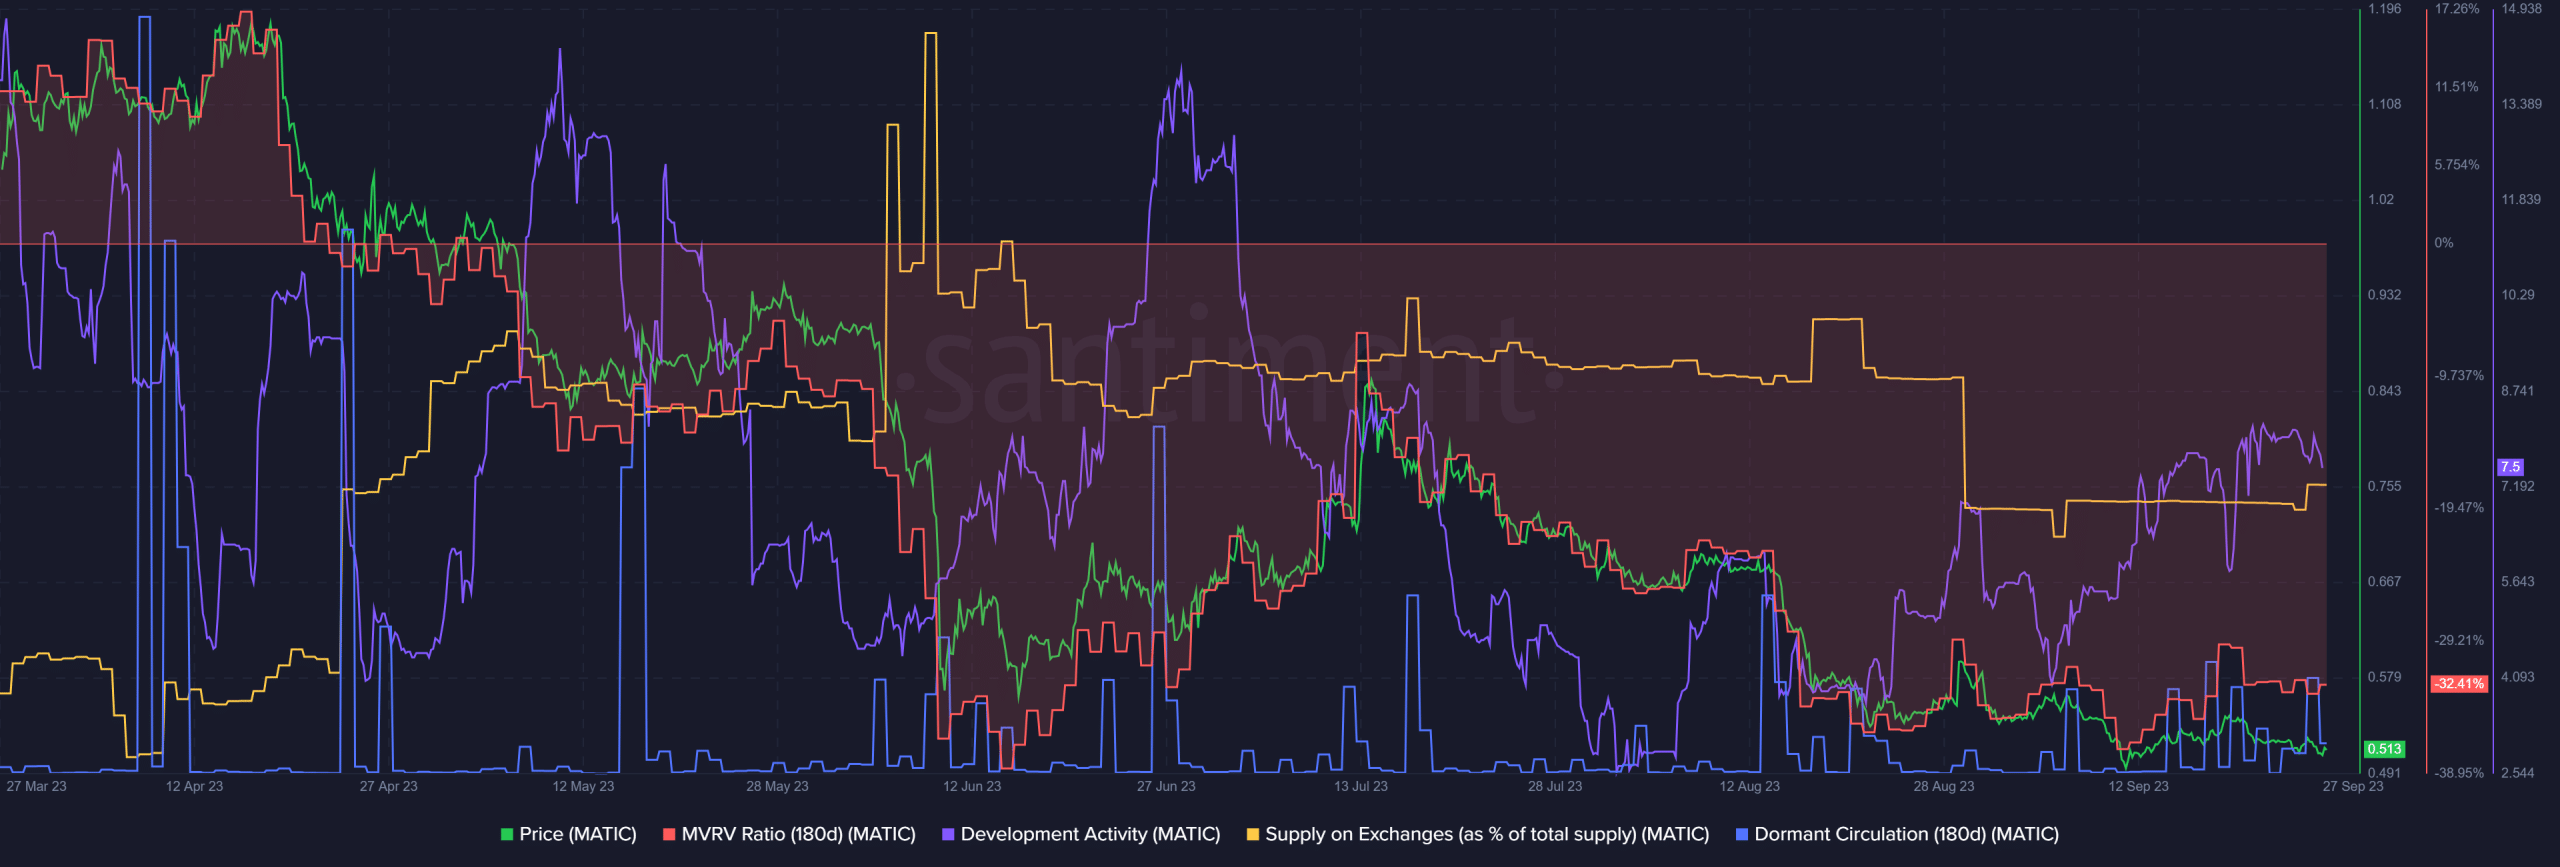
The development activity has trended higher since August without heed to the declining prices. This is an encouraging factor for long-term holders. The supply on exchanges has also slowly dwindled since mid-July to show an accumulation of the tokens in cold wallets.
Is your portfolio green? Check the Polygon Profit Calculator
The Market Value to Realized Value (MVRV) ratio signaled MATIC was undervalued, but does not promise the prices will rally. In recent weeks, the dormant circulation metric saw multiple spikes to underline the sudden movement of previously dormant MATIC. This likely pointed to individual waves of selling.


