Audiera surges 143% in 2 weeks – But BEAT traders should not go long yet
Despite the strong short-term momentum, the range formation in place could complicate BEAT's bullish breakout.

Audiera [BEAT] has rallied 11.77% in the past 24 hours and was up 143.3% in a fortnight. The token was challenging the $1.45 resistance level, the same one that had rebuffed BEAT bulls on the 24th of May.
The past 24 hours’ trading volume shot higher by 67%, and the Open Interest was up by just over 14%. Strong Spot and derivatives volume alongside swift price gains tend to indicate short-term strength.
AMBCrypto had reported that Audiera was a token to keep an eye on. So far, this has been spot on.
Is BEAT ready to continue its uptrend?
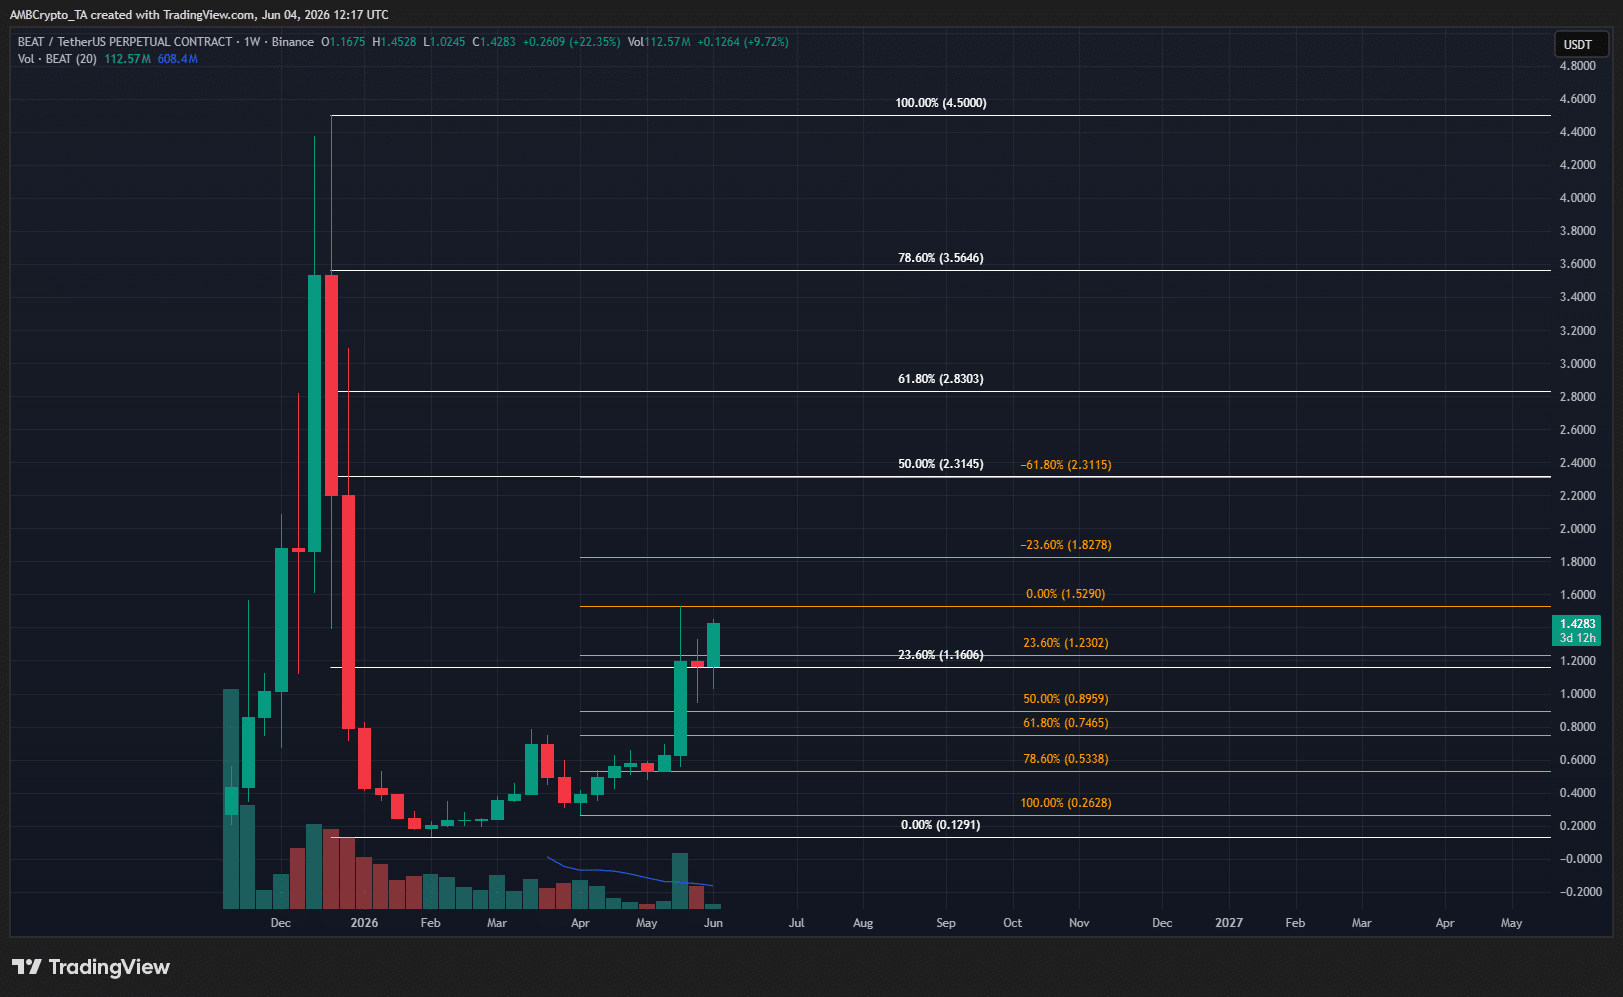
The higher timeframe trend and structure were decidedly bearish. Yet, BEAT has made an internal bullish structure shift after setting a high at $0.78 in March. This meant that there were two scenarios swing traders needed to be prepared for.
The more hopeful one would be a breakout past the $1.52 local high, which would signal a bullish continuation. This could reach the 50% retracement level at $2.31, and possibly even climb as high as $3.56.
The other scenario would be a BEAT slump back below $1.16, which could take prices as far south as $0.53.
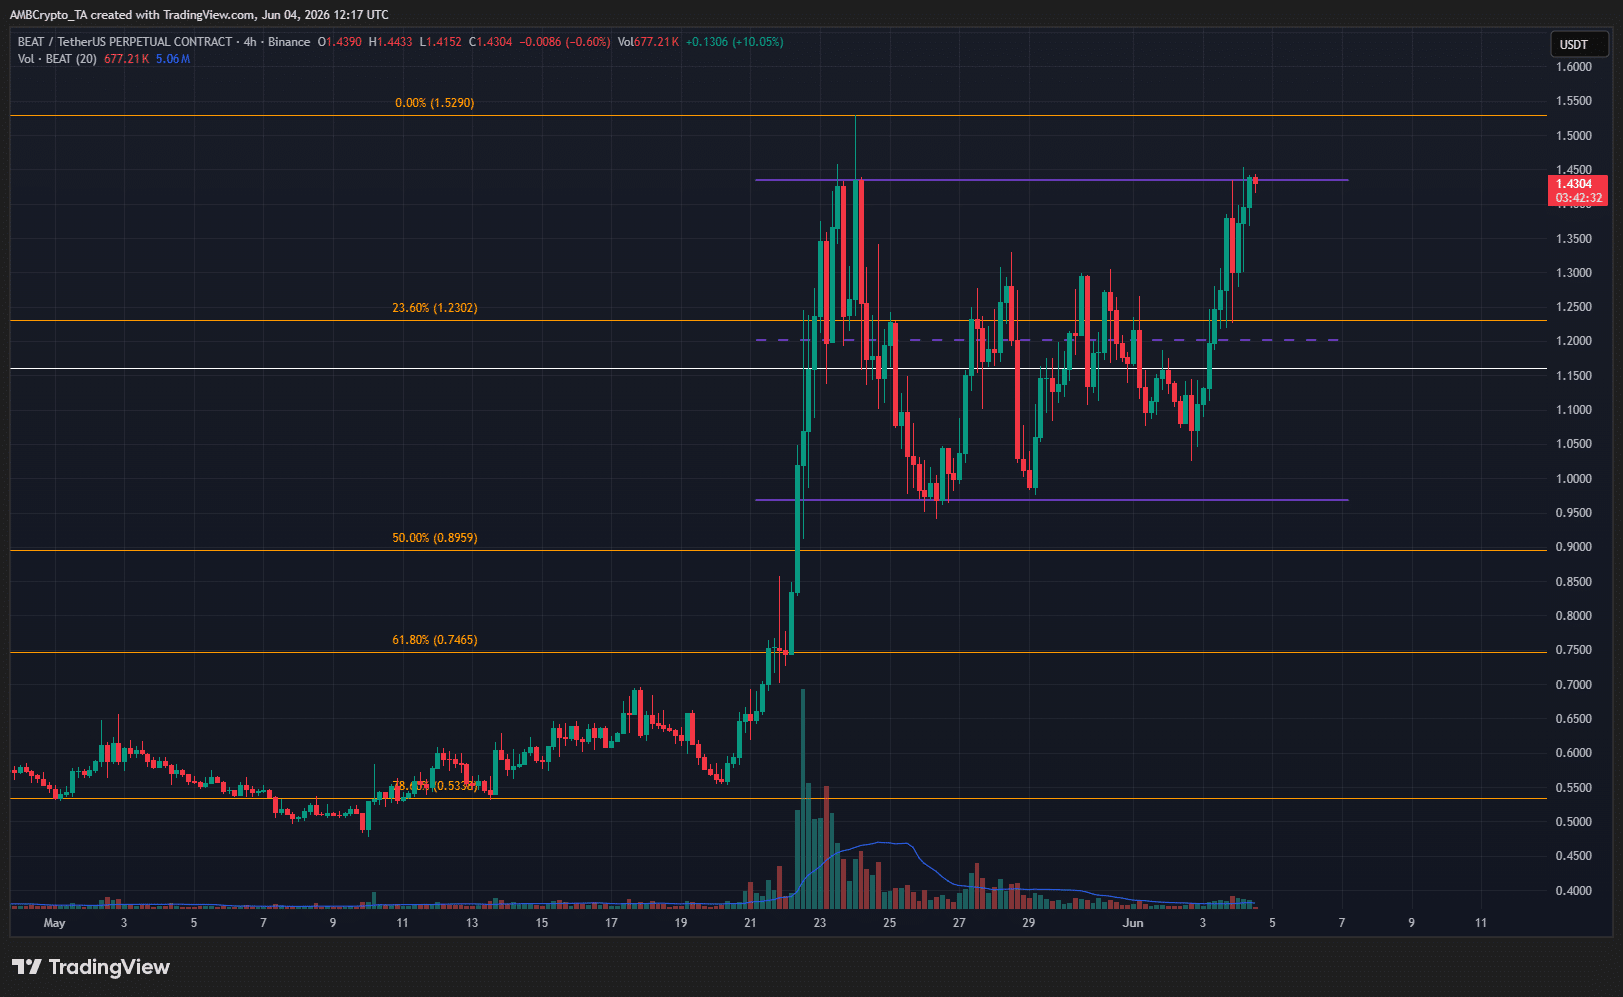
Traders can take it one step at a time. Zooming in, the price action showed a range formation from $0.96 to $1.43 over the past two weeks. The range high and the area up to $1.52 presented a sizeable short-term supply zone to BEAT.
It could be difficult for the bulls to overcome this area.
Traders’ call to action- Respect the overhead supply
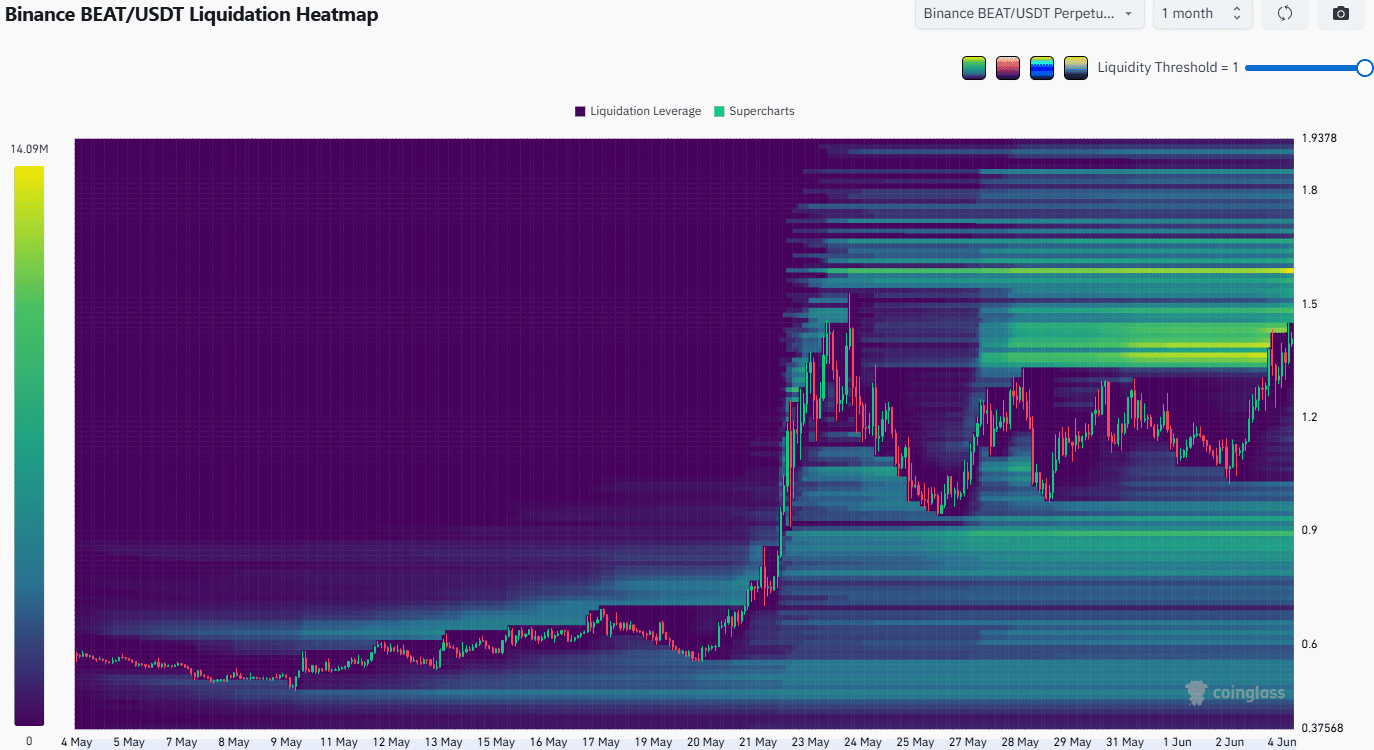
The 1-month liquidation heatmap showed a cluster of short liquidations from $1.35-$1.68. Some of these liquidations have already been triggered. There was more liquidity to the north, which can pull prices higher.
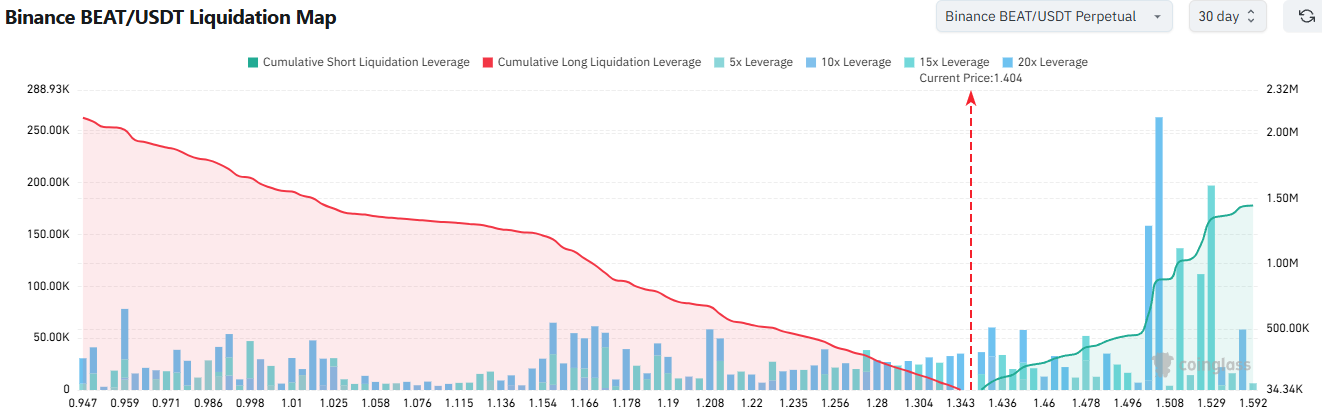
The cumulative short liquidation leverage was much higher overhead than it was to the south. This was another compelling reason to expect a short-term move toward $1.5-$1.6.
Yet, given the range established, a liquidity sweep may be followed by a rejection and a retracement to the $0.96 low.
Traders should expect the $1.52 supply zone to hold until BEAT manages to close a day’s trading session above $1.6.
Final Summary
- BEAT’s rally has lost some steam with its recent range formation.
- The cluster of short liquidations overhead could be targeted, but a BEAT bullish breakout is not a guaranteed outcome.