Avalanche, Algorand, Litecoin Price Analysis: 22 December

The last two days witnessed a notable recovery for most alts as Ether crossed the $4,000-mark. But the bears were quick to prevent a sustained bullish rally. Accordingly, Litecoin continued its descending triangle while flashing weak near-term technicals.
Avalanche found immediate testing support at the 23.6% Fibonacci level while Algorand struggled to cross the $1.39-mark.
Avalanche (AVAX)
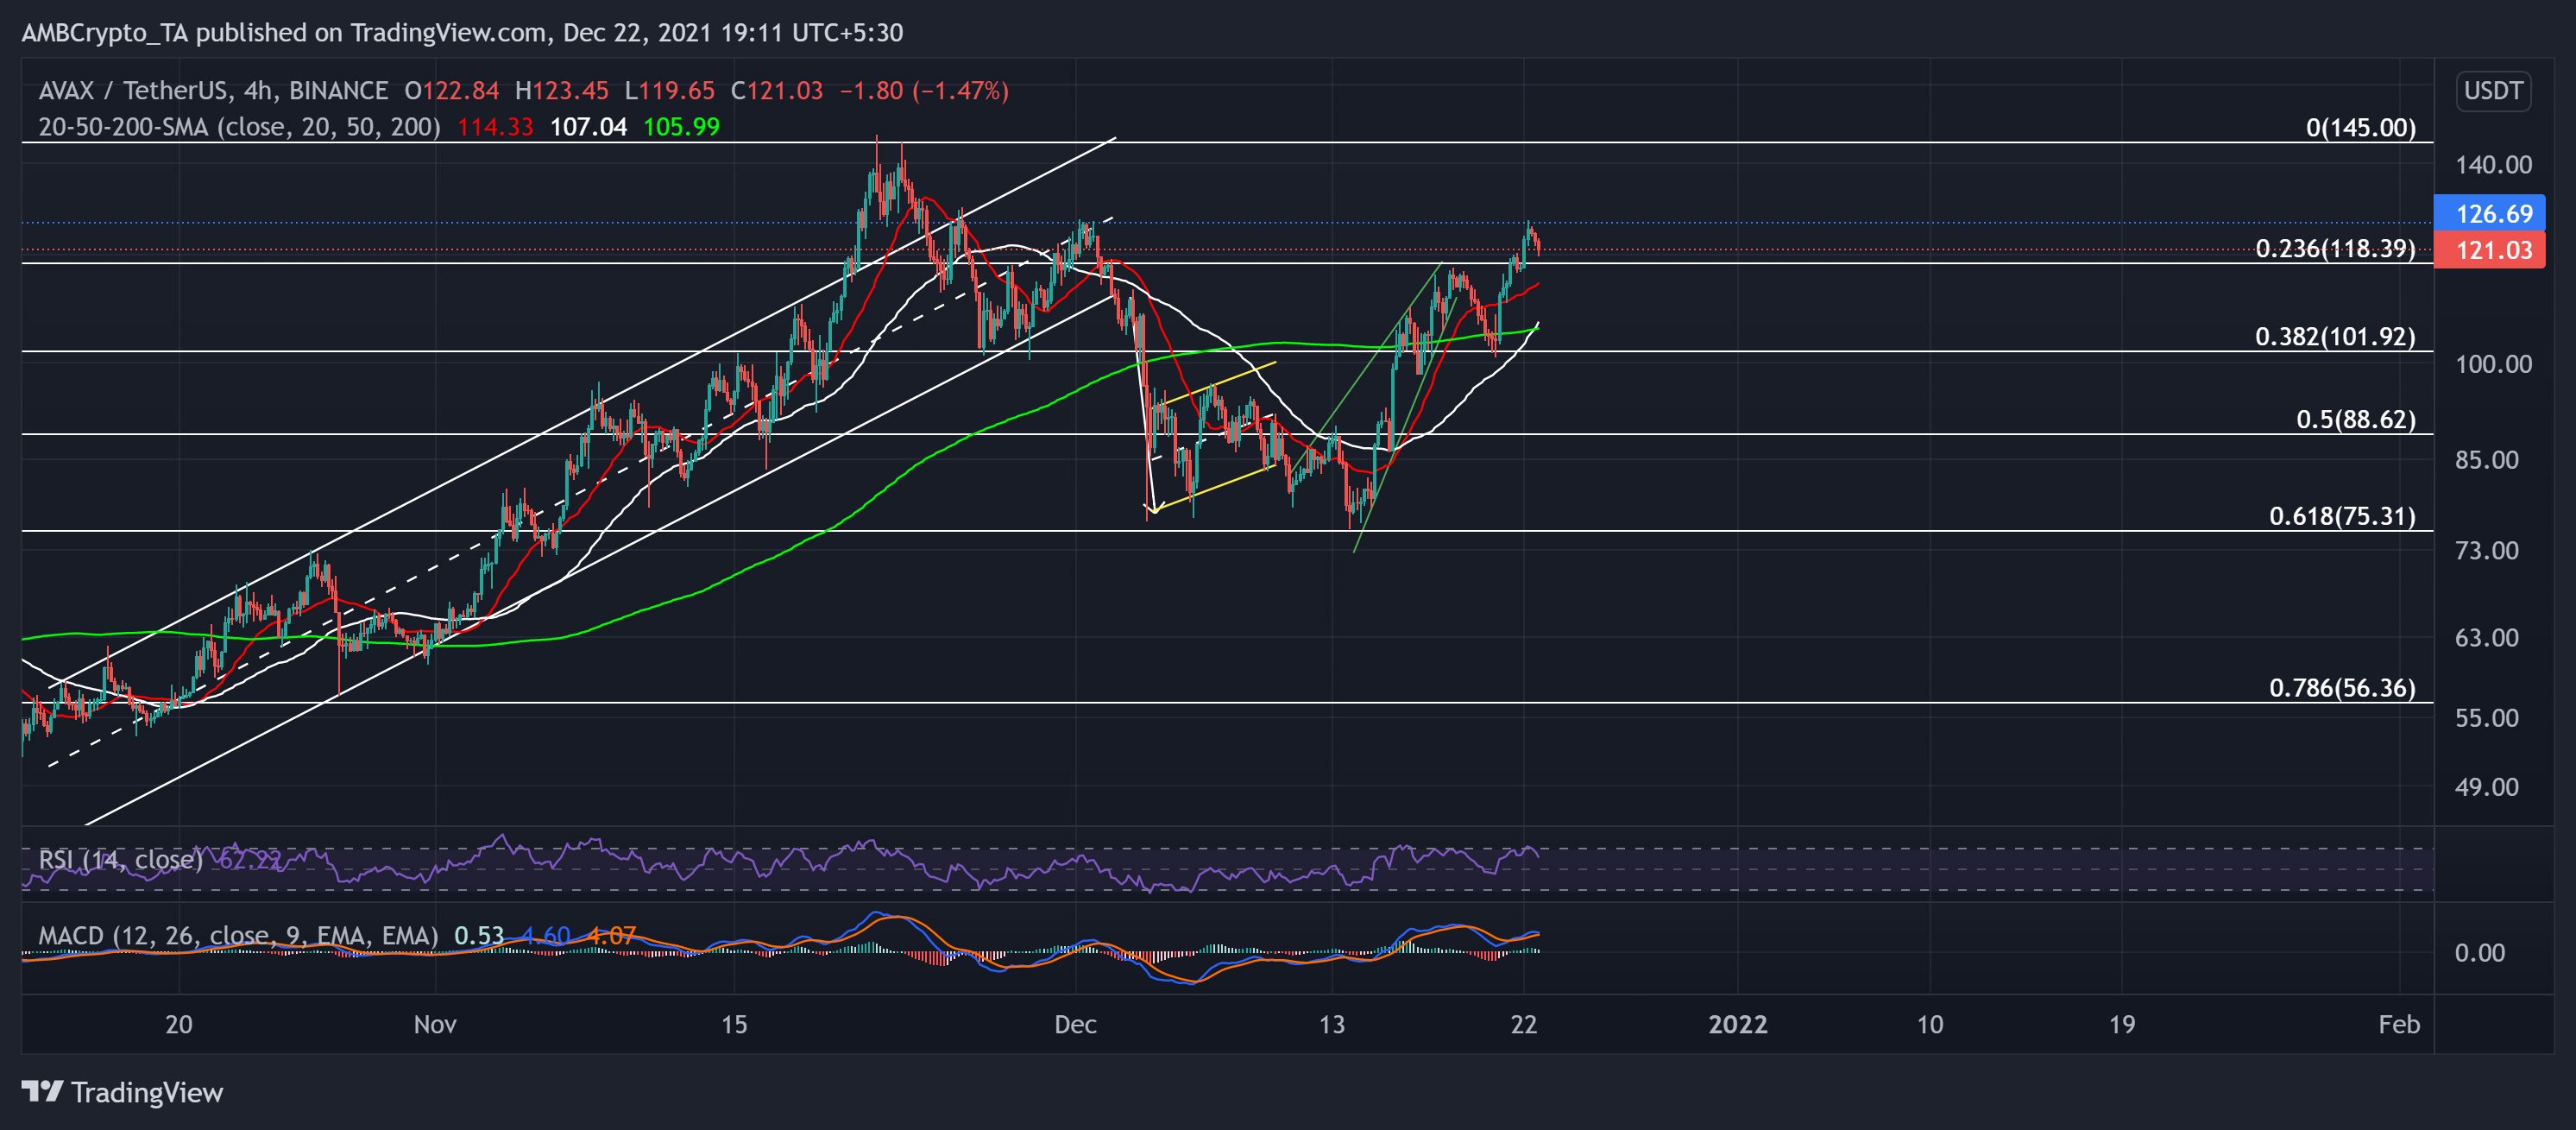
AVAX was one of the few cryptos that constantly found higher Fibonacci supports over the past eight days. The alt registered a monstrous 55.3% nine-day ROI. Although it invalidated its long-term bullish trendline (since July), it bounced back from the 61.8% golden Fibonacci level.
The digital currency saw an expected rising wedge breakdown but found support at the 38.2% Fibonacci mark. As a result, the alt saw a v-shaped recovery over the past two days but saw resistance at the $126-mark. Any retracements from here would find testing support at the 23.6% level.
At press time, AVAX traded above its 20-50-200 SMA at $121.03. The RSI retested the overbought region six times since 15 December while finding support at the midline. Further, the MACD continued to flash a bullish bias.
Algorand (ALGO)
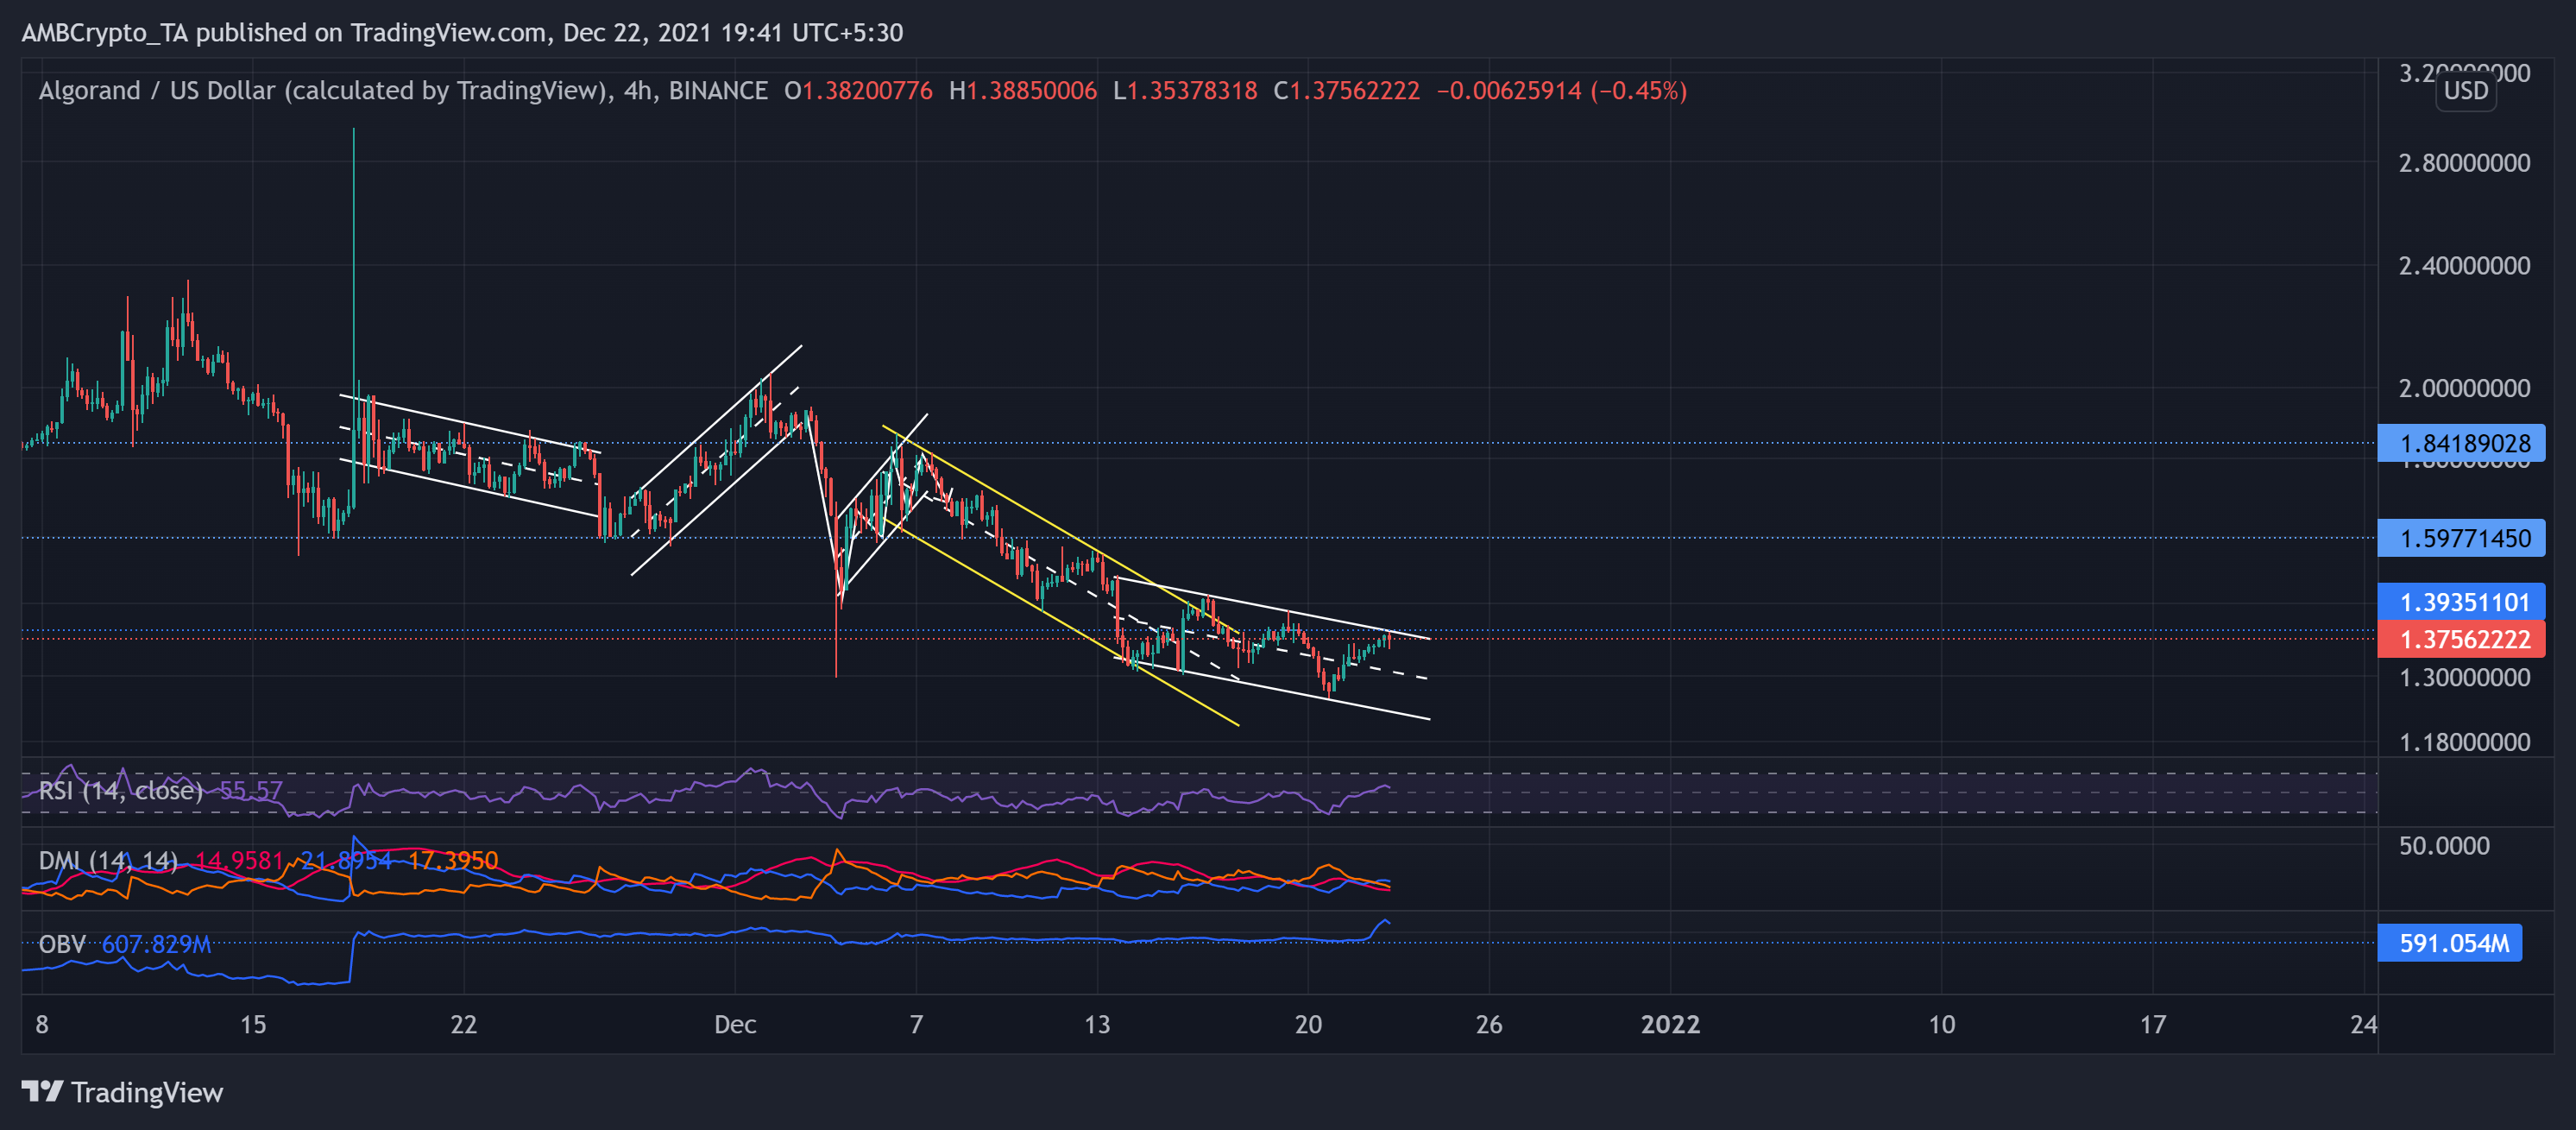
ALGO performed quite poorly after poking the $2.04-mark on 2 December. Then, the price action saw a substantial breakdown as it fell below the $1.84-mark.
As a result, after forming a bearish flag, it further broke down below the $1.39-mark (15-week resistance) in a down-channel (yellow). As the coin saw a nearly 9.43% two-day recovery, it saw a pullback from the aforestated level that also coincided with the upper channel.
At press time, ALGO traded at $1.3756. The RSI stood at the 54-level but struggled to sustain itself above the half-line. Also, the DMI displayed a slight bullish preference with a weak directional trend. Despite the price action marking newer lows, the OBV seemed to find strong near-term support, indicating the possibility of easing the selling pressure.
Litecoin (LTC)
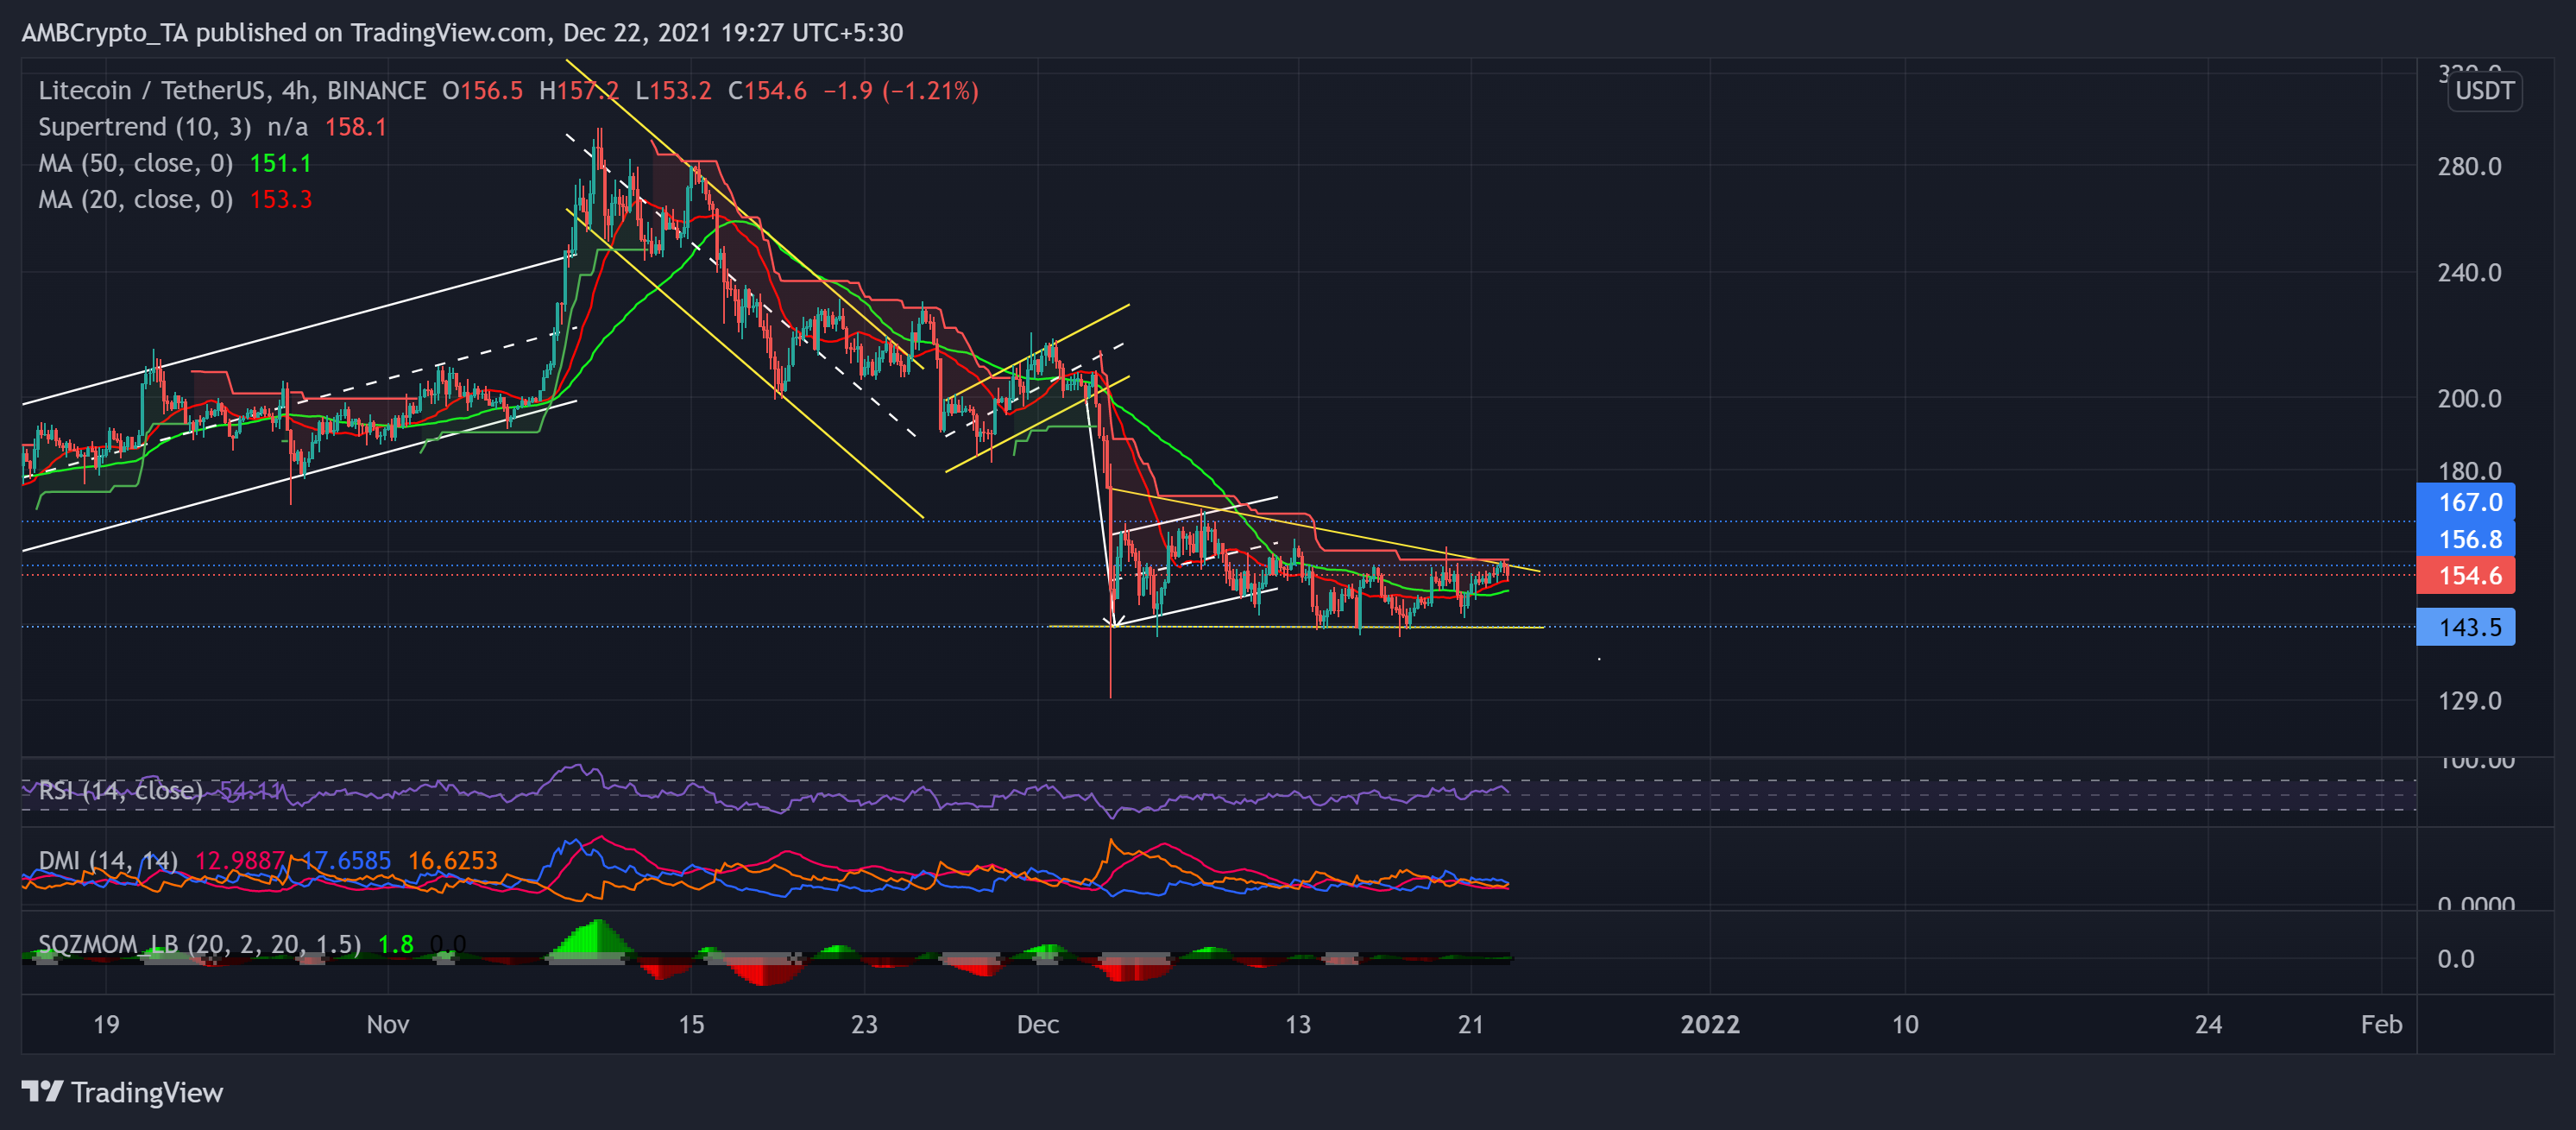
LTC fueled its bearish drift after an up-channel breakdown on 3 December as the price action moved below its 12-week resistance at the $156-mark. After an expected bearish flag breakdown, the price action found an oscillating range between the $143 and $156-mark.
Over the past 18 days, LTC formed a descending triangle by marking lower highs while maintaining the $143.5 support. Not surprising to see the Supertrend flash a sell signal.
At press time, LTC traded above its 20-50 SMA at $154.6. The RSI sustained above the midline over the past day but seemed to slacken. Moreover, the DMI lines were on the verge of a bearish crossover but displayed a weak directional trend. The Squeeze Momentum continued to hint at the squeeze phase with low near-term volatility.