Avalanche [AVAX]: Can incoming demand flip market’s bearish bias

Disclaimer: The findings of the following analysis are the sole opinions of the writer and should not be considered investment advice
These have been uncertain times on the lower timeframes for Bitcoin and the entire crypto-market. The latest bullish move north was strongly reversed and the emotion that rules the market right now appears to be fear.
Now, there was the possibility that Avalanche would continue lower on the charts like it did in December. On the other hand, there are levels and areas to the south where demand could step in. However, risk-averse investors should be quite cautious in these times.
AVAX- 12 hour chart
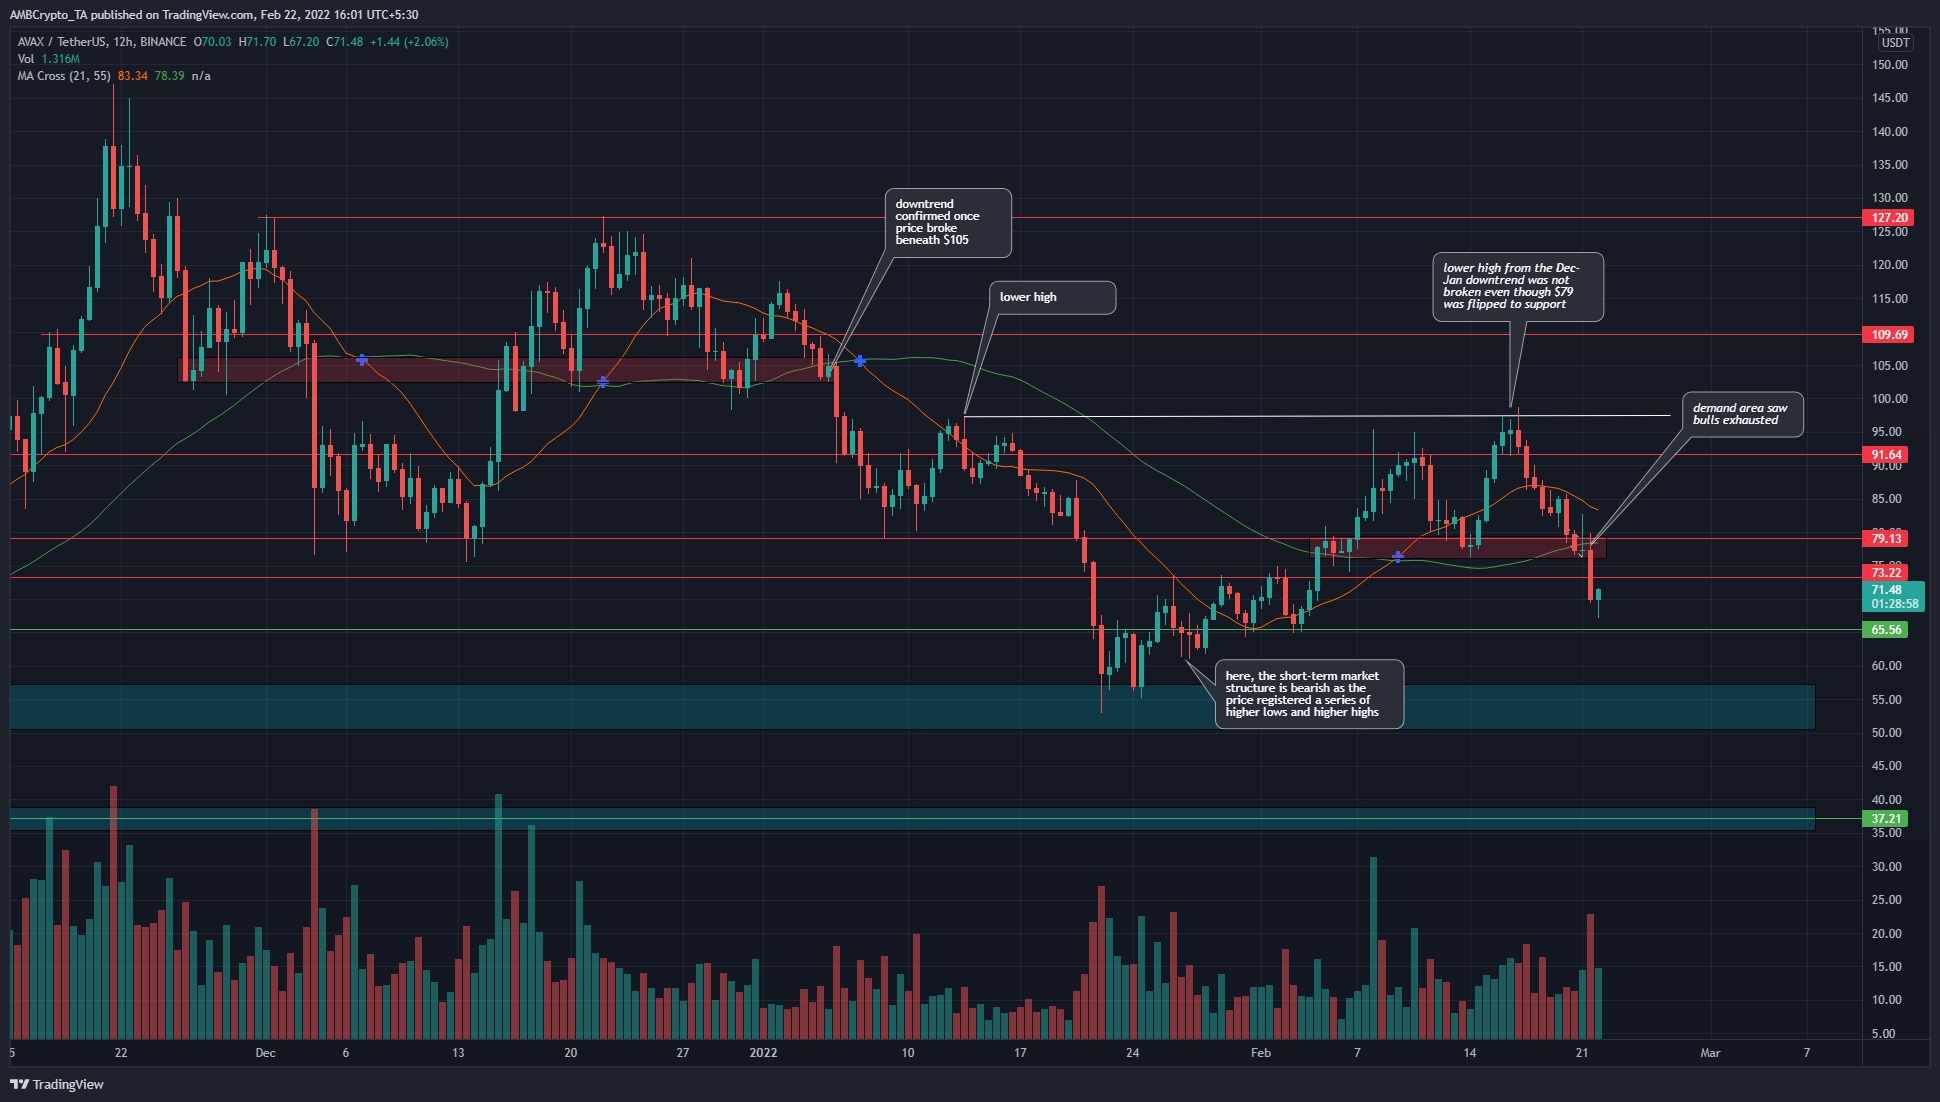
The $79.13-area served as demand a couple of weeks ago, but the price has been on a downtrend since December. Moreover, the $79-area holds importance because it saw demand in early December and late December before bulls were exhausted in mid-January.
This saw the price test the $55-area as demand and a positive reaction was seen. Alas, the downtrend’s previous higher low at $97.6 was not flipped to support even though a candlewick did push up there.
The outlook for the next few weeks remains uncertain, although it is leaning heavily towards the bearish side. The $65-level and $55-area of demand could be visited in the days to come and could see the bulls force a reaction.
However, a retest of the $73 or $79-level is the safer bet to enter a short position, based on market structure.
Rationale
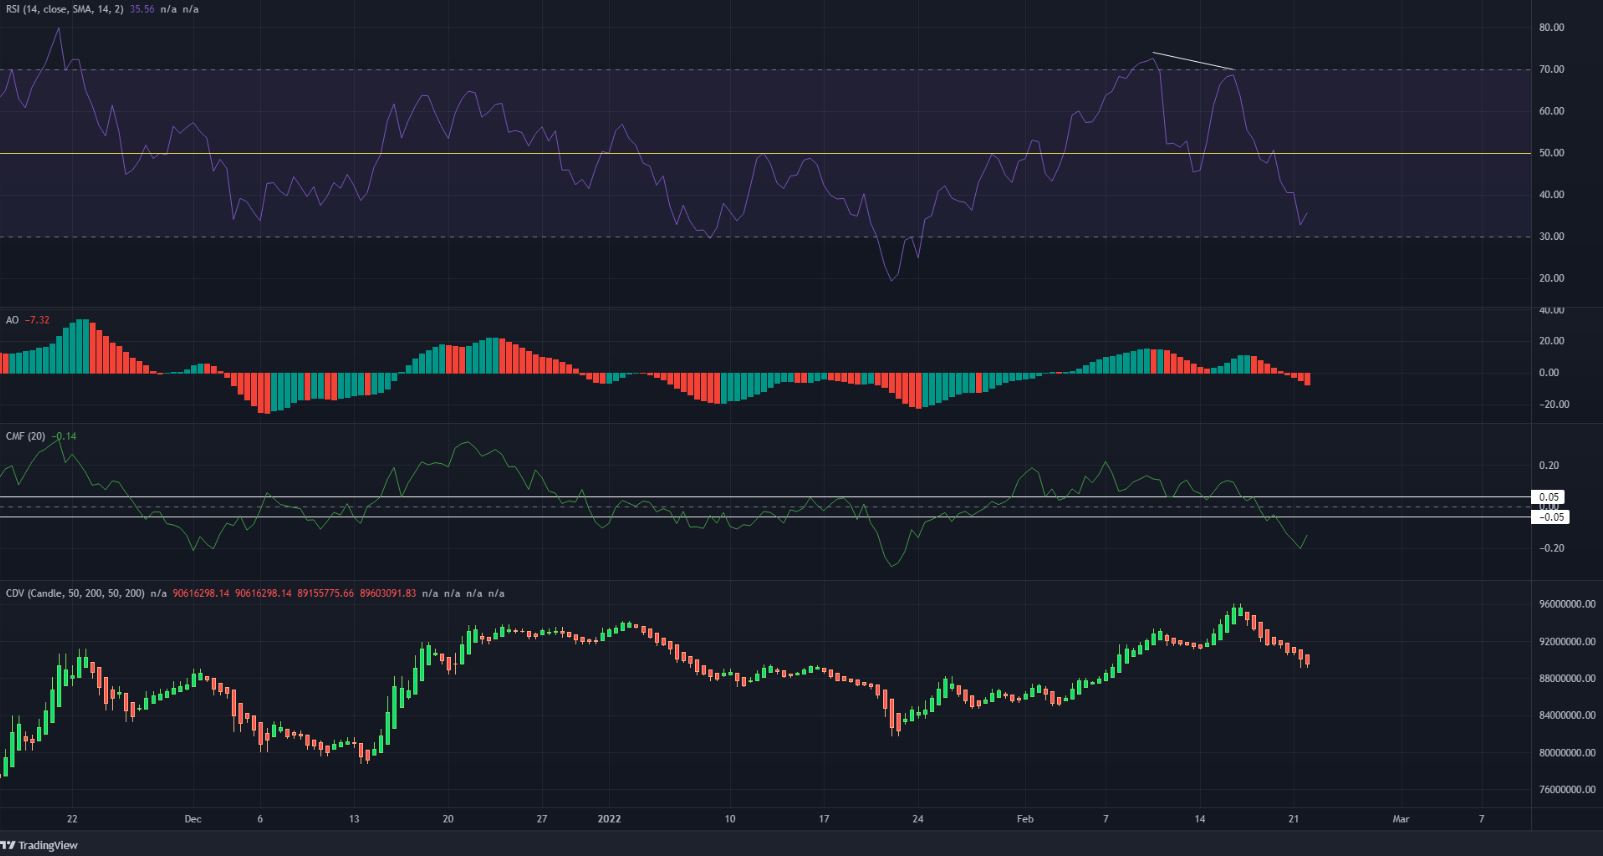
The 12-hour RSI flashed a bearish divergence last week. The indicator made a lower high while the price made a higher high, marking the local top, and the RSI dived back beneath neutral 50. The Awesome Oscillator also fell beneath the zero line to show bearish momentum was strong.
The CMF fell under -0.05 to show significant capital flow out of the market while the CDV also pictured strong selling volume. The 21 SMA (orange) was moving above the 55 SMA (green) in response to the bullish move earlier this month, but the price had fallen beneath the 55 SMA.
Conclusion
A bearish bias appears to be reasonable in the weeks to come. The strength of the bears was seen in the $95-area and might be showcased once again in the next few days upon a bearish retest of the $73 and $79-levels. Demand could arrive at $65 and $55-levels, but might not reverse the downtrend.