
While Bitcoin struggled to counter its 4-hour 20-SMA, Avalanche, Chainlink and Curve DAO token flashed oversold RSIs. Their near-term technicals continued to flash a bearish edge. but is that it?
Avalanche (AVAX)
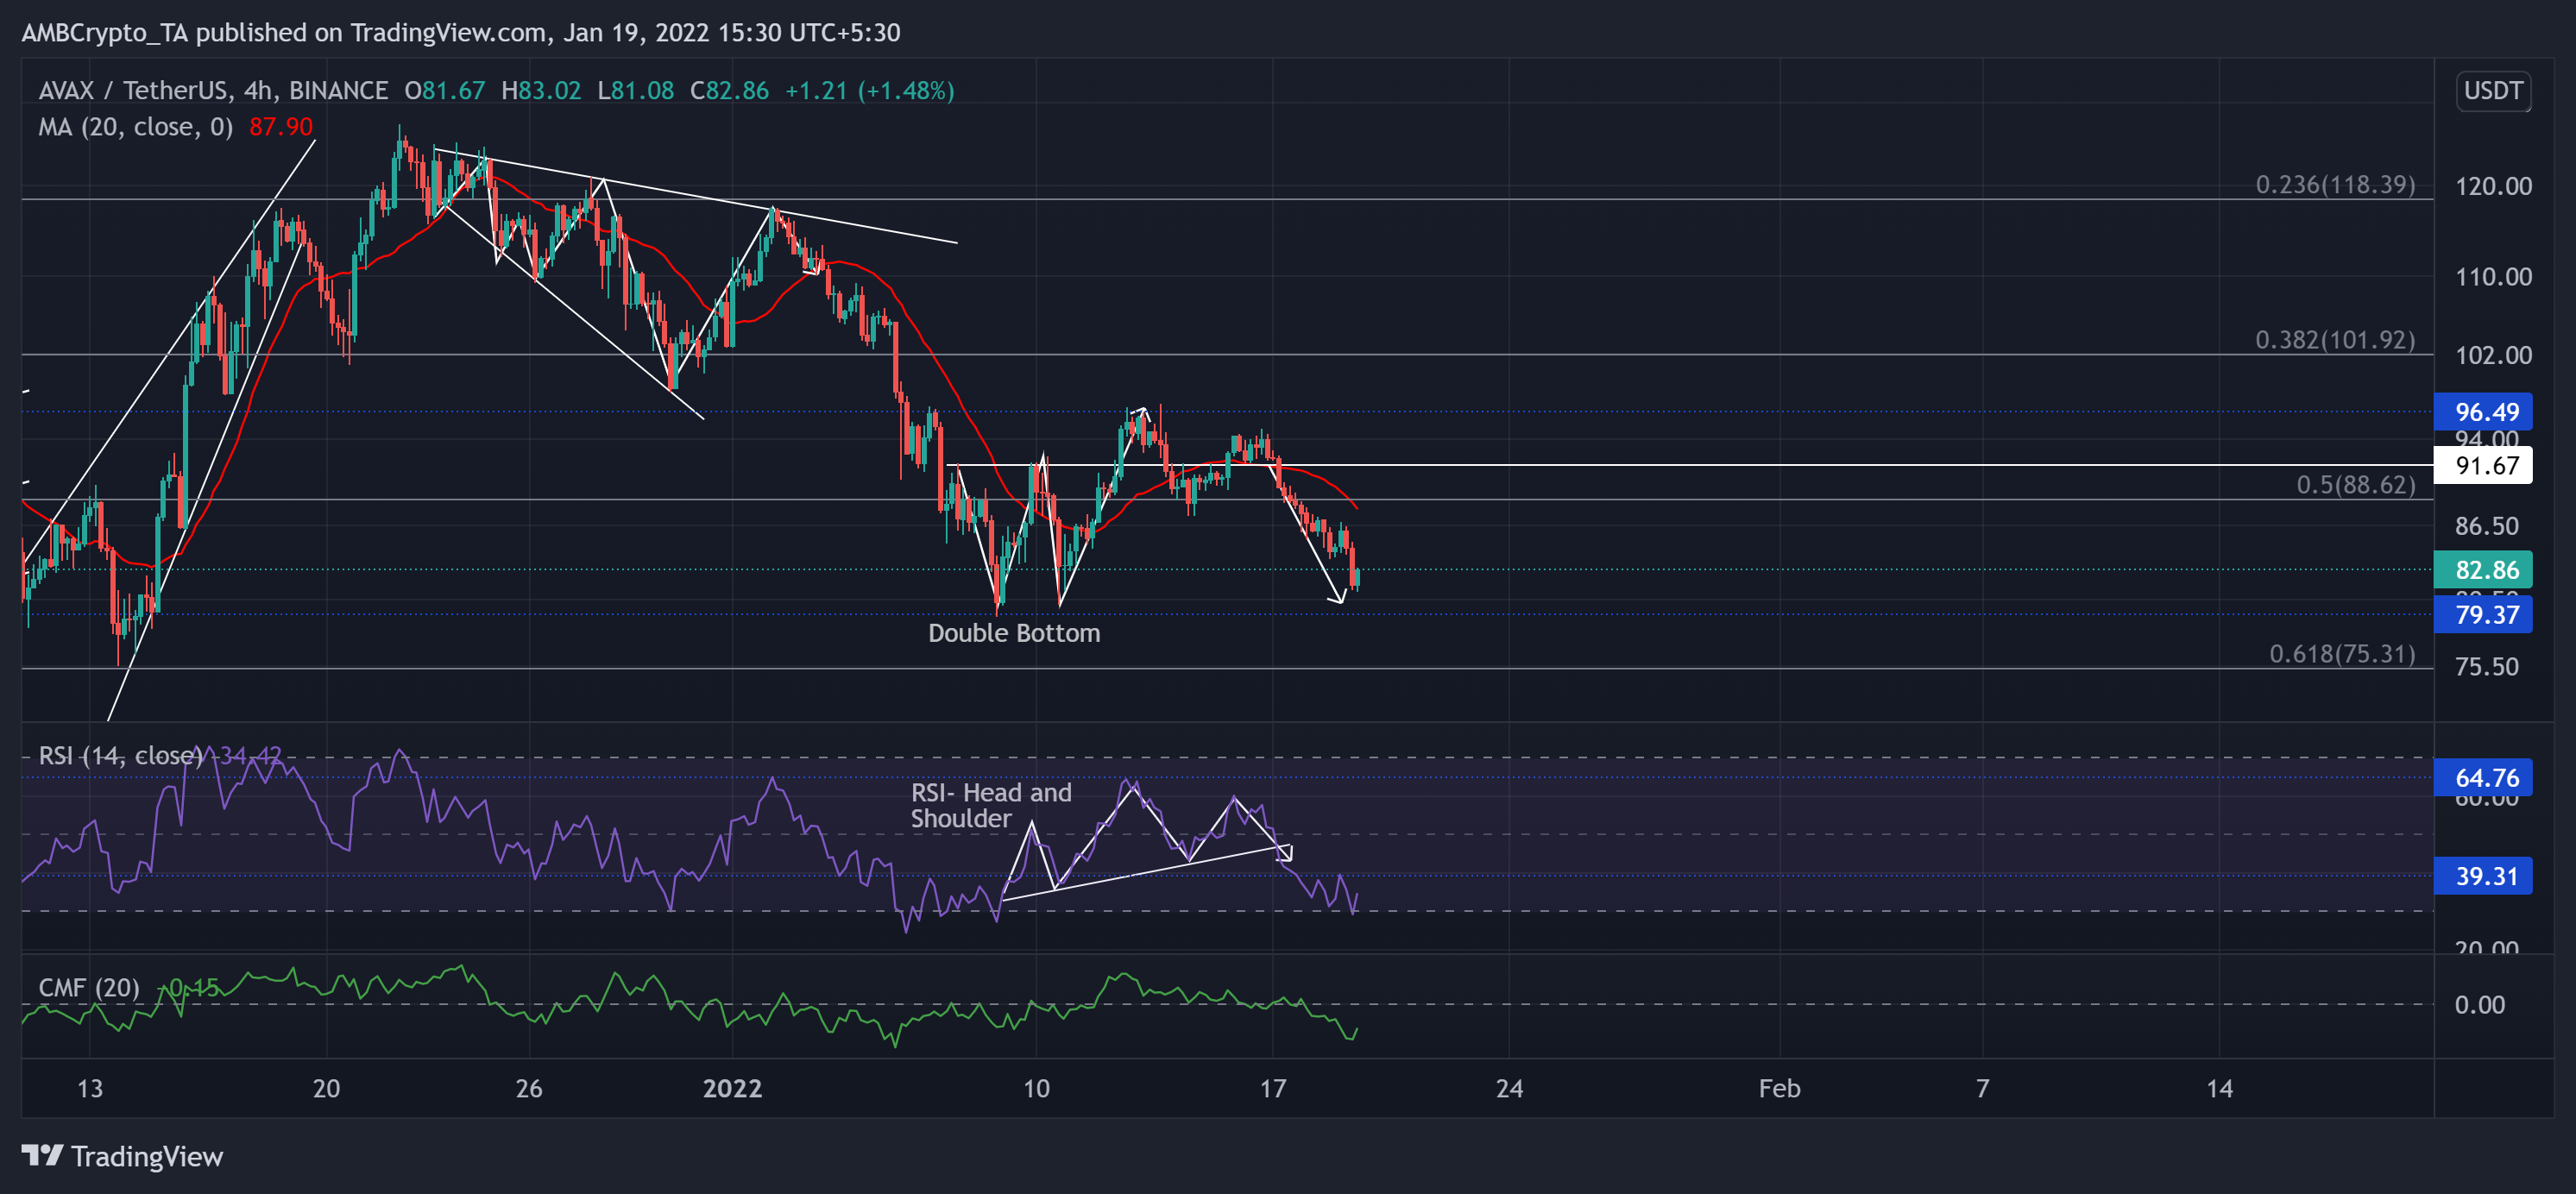
Source: TradingView, AVAX/USDT
After hitting its three-week high on 22 December, the alt steadily declined by marking lower peaks. It saw a 37.58% retracement and tested the $79.3-support twice in the last ten days.
The double-bottom breakout on its 4-hour chart failed to cross its month-long resistance at the $96.49-mark. Over the last three days, AVAX lost nearly 14% of its value. As a result, it plunged below its long-term 50% Fibonacci support. Now, the immediate resistance stood at the 20-SMA (red).
At press time, the altcoin was trading at $82.86. After confirming the Head and shoulder pattern, the 4-hour RSI tested the oversold region. Any close above the 39-mark would propel a fast recovery. Also, the CMF saw low money volumes but seemed to improve.
Chainlink (LINK)
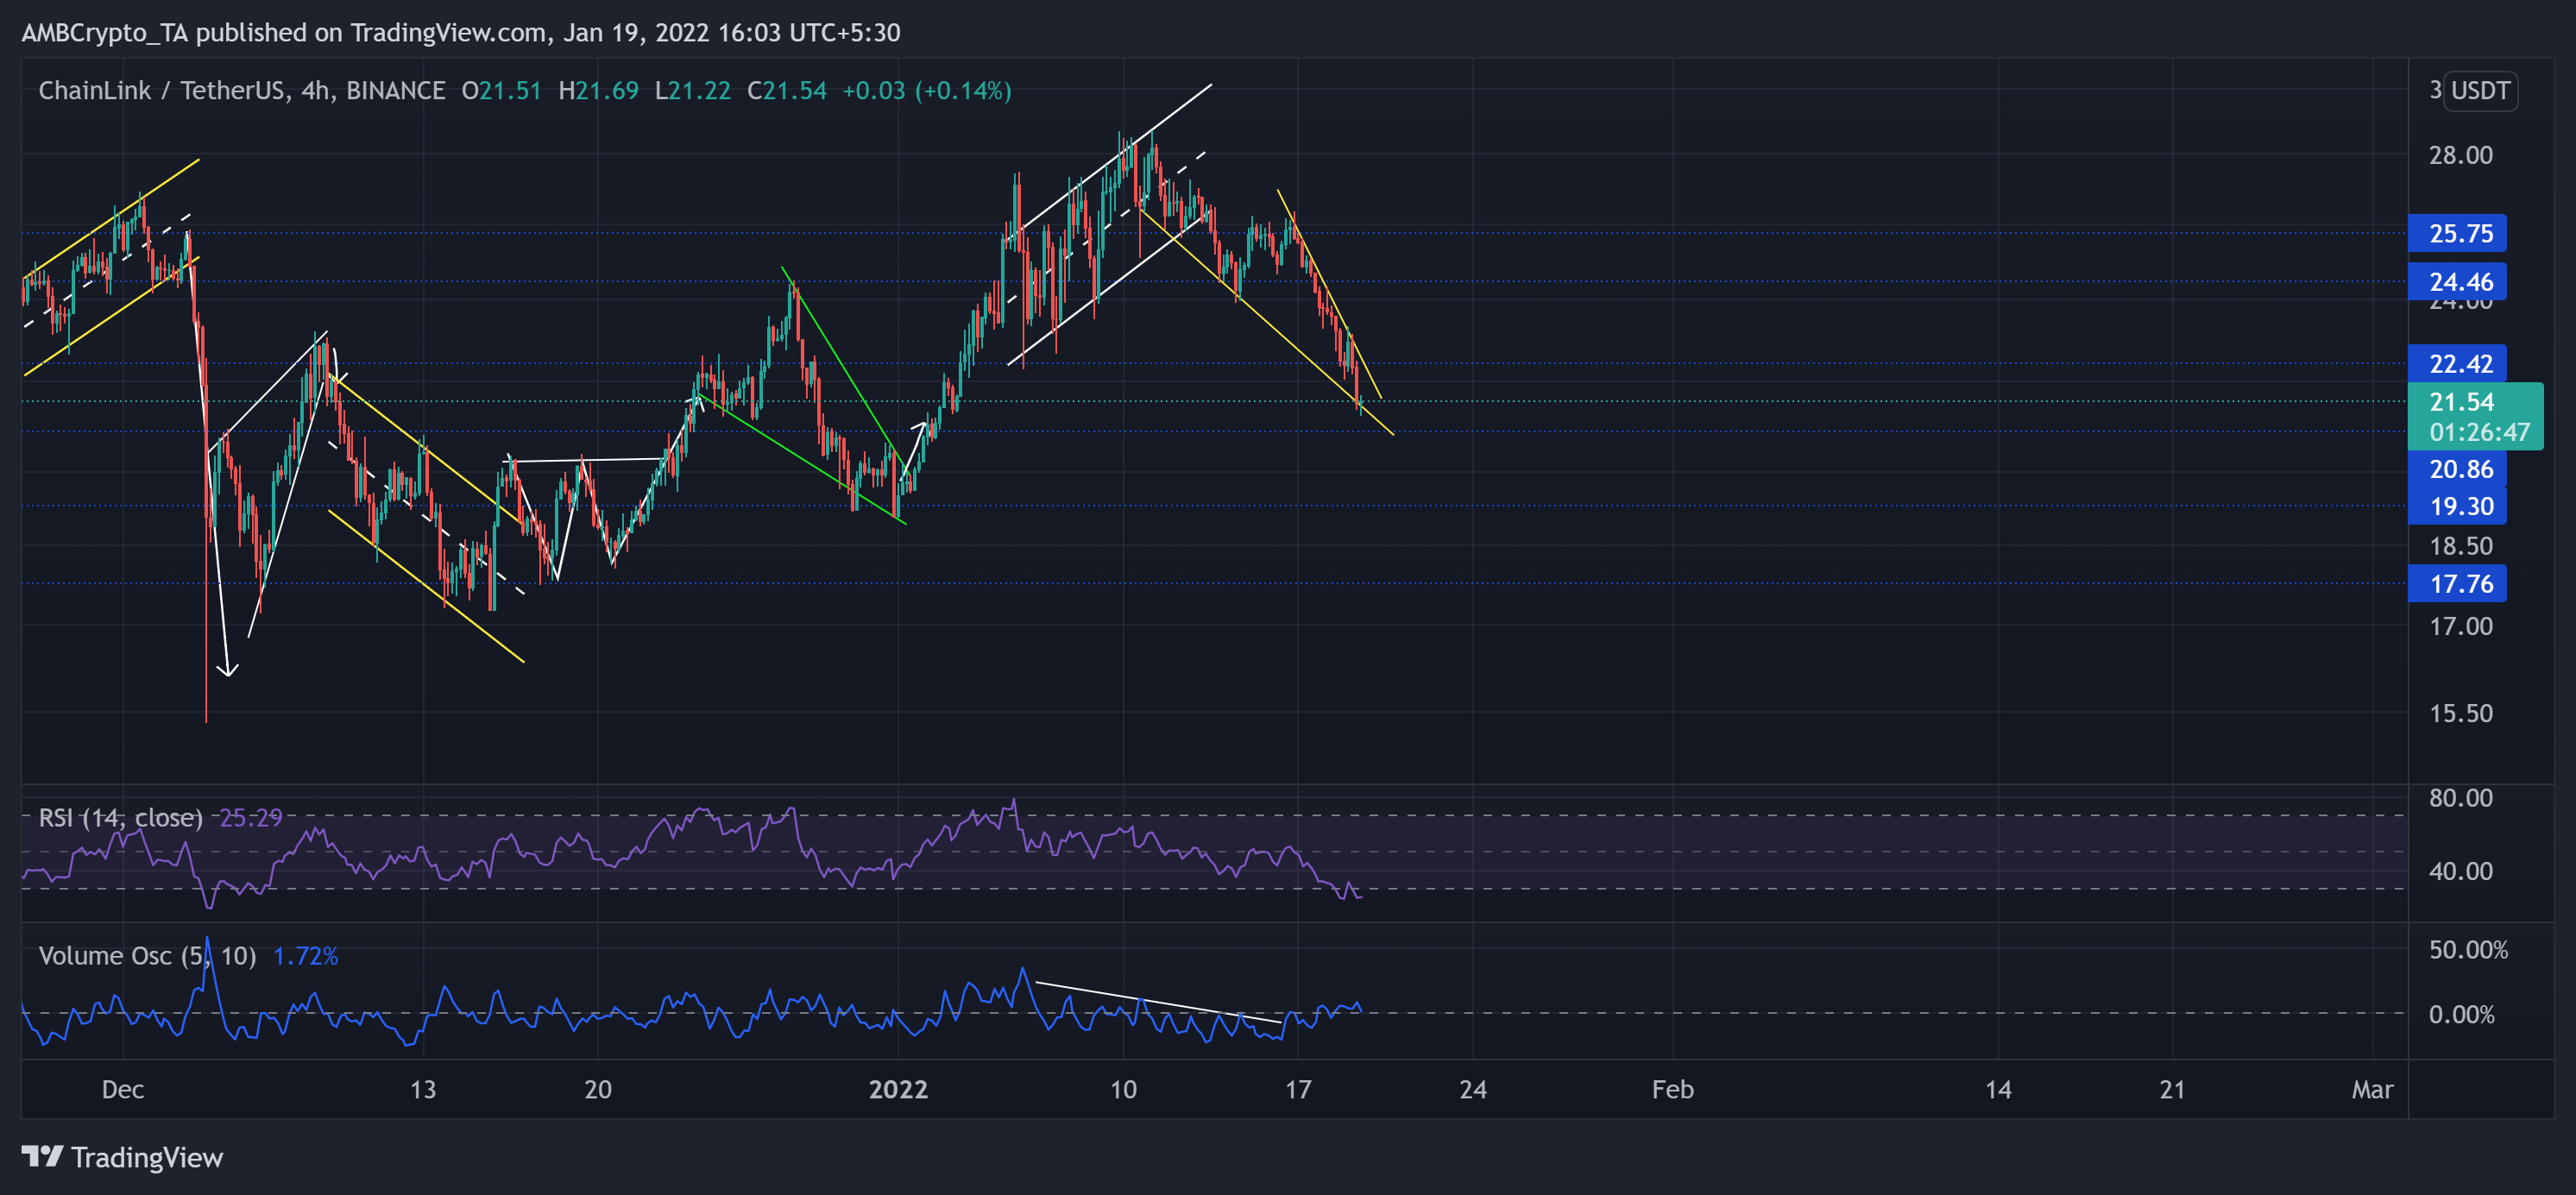
Source: TradingView, LINK/USDT
LINK’s bulls retested the $22.42-level four times over the past month. They finally breached this level after the falling wedge (green) breakout. This breakout transposed into an up-channel (white). LINK noted a 50.2% ROI (from 1 January low) until it touched its seven-week high on 11 January.
While the Volume Oscillator marked lower peaks during this phase, the alt couldn’t sustain the bull rally. LINK lost over 25% of its value (since 11 January) until press time while it marked a falling wedge (yellow, reversal pattern).
Now, the current zone becomes vital for the buyers to step in and stall the sell-off. At press time, LINK was trading at $21.54. The alt’s RSI hovered in the oversold region and crossing the 30-mark is crucial for the bulls to support the recovery phase.
Curve DAO Token (CRV)
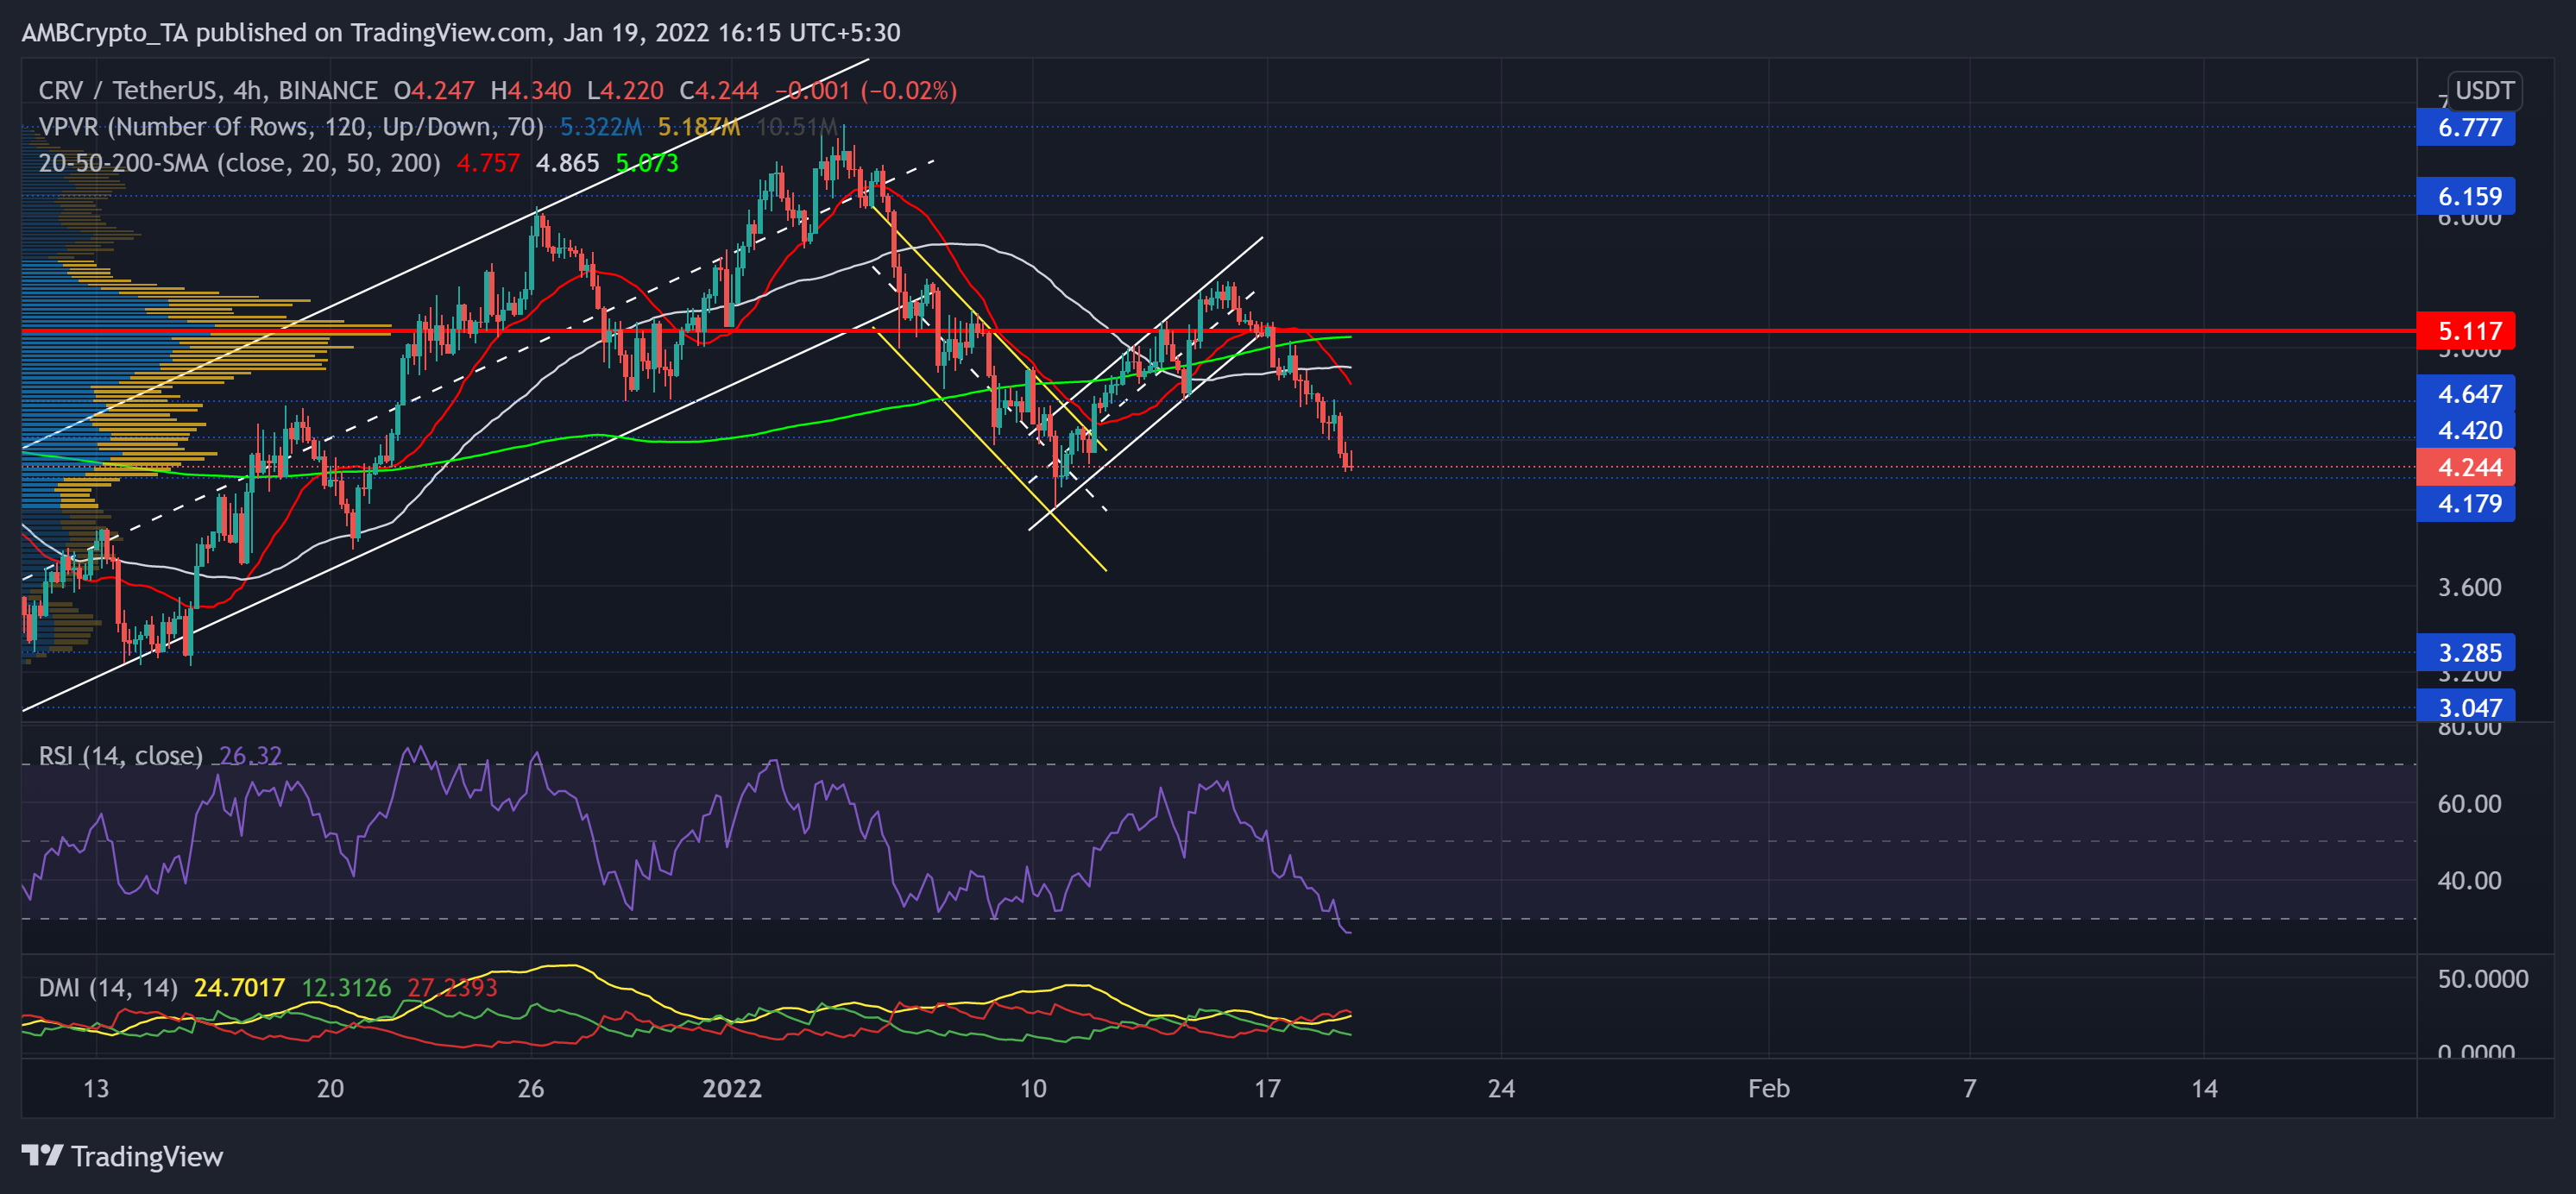
Source: TradingView, CRV/USDT
After ensuring the $4.17-support, the bulls transposed the down-channel breakout into an up-channel (white). After an over 36% ROI (from 10 January), CRV crossed the Point of Control (red).
However, it failed to sustain a close above this level after an up-channel breakdown in the last few days.
Now, as the 20 SMA (red) fell below the 50 SMA (grey) and 200 SMA (green), the selling influence increased. The immediate support stood at the $4.17-level.
At press time, CRV traded below its 20-50-200 SMA at $4.244. The RSI saw an over 30 point plunge in the last three days. Thus, it now depicted an oversold position. Also, the DMI confirmed the bearish edge. But the ADX displayed a slightly weak directional trend for the alt.