Avalanche, Litecoin, NEM Price Analysis: 16 December

While Avalanche defied the broader market tendencies by noting soaring gains, Litecoin and NEM refrained from stepping down from the bearish bandwagon. The latter two cryptos formed reversal patterns on their 4-hour chart while flashing mixed near-term signals.
Avalanche (AVAX)
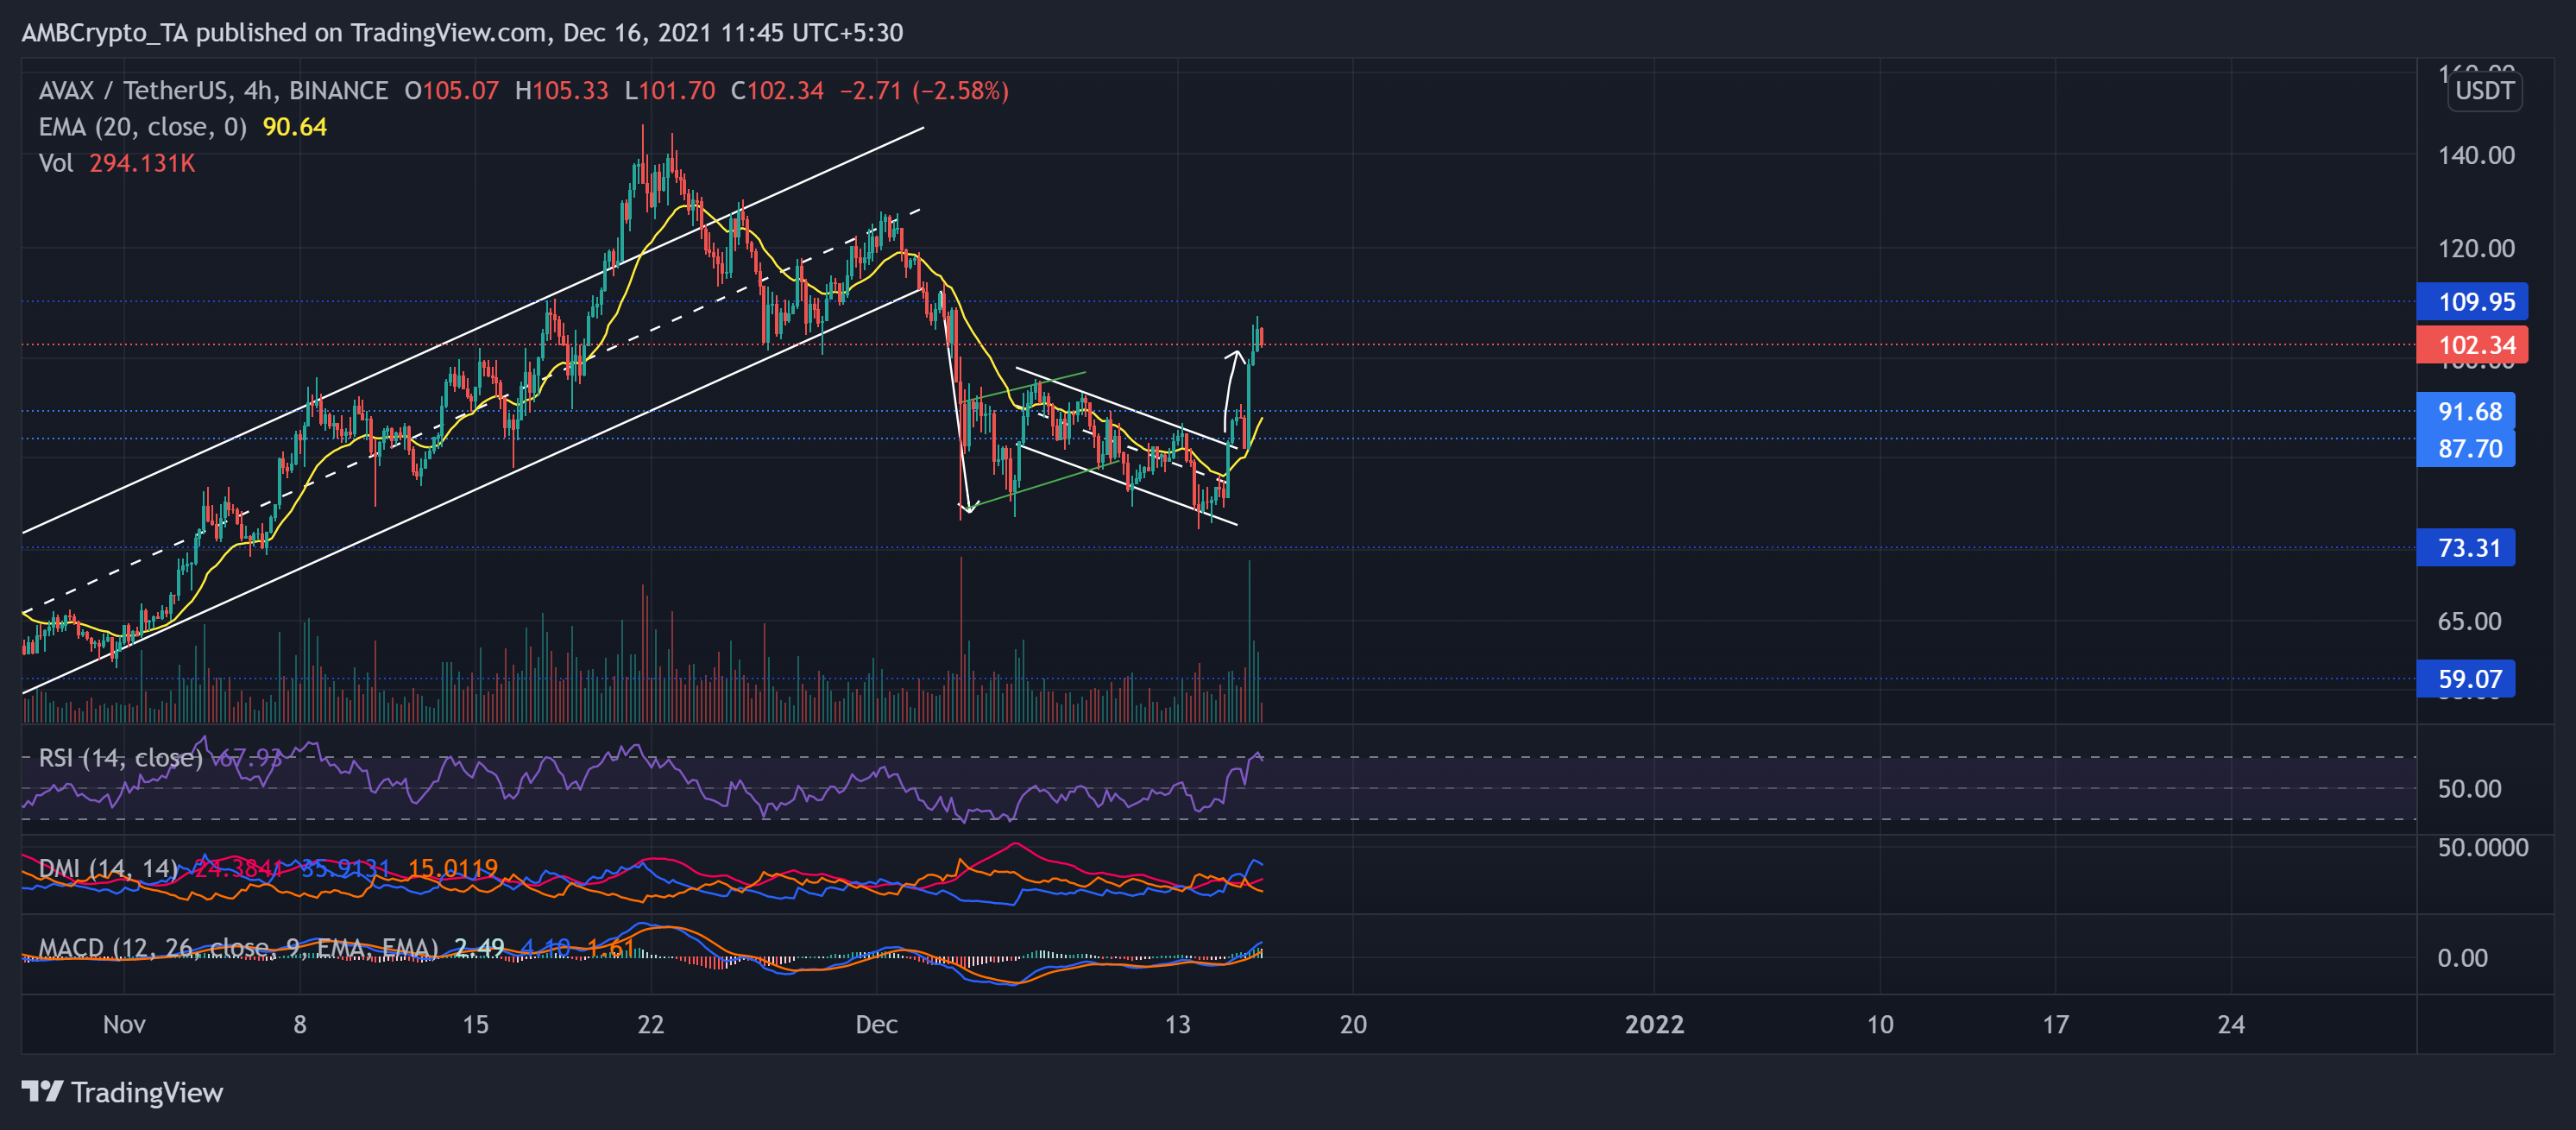
AVAX persistently slackened after striking its ATH on 21 November. As a result, the price action saw an up-channel breakdown and formed a bearish flag. This fall also invalidated its long-term bullish trendline (since July). This decline pushed the price below the $87.7 mark as the price poked its five-week low on 13 December.
The alt saw soaring gains over the past day. It saw a down-channel breakout after an over 37.5% jump from $78 on 14 December until it poked $107.2 (two-week high) on 15 December. The integration of the USDC stablecoin on its blockchain became a presumed propellant for this jump.
Now, as the pullback occurred, the 20-EMA (yellow) stood as strong support. At press time, AVAX traded at $102.34. The RSI saw an expected dip from the overbought region as it looked south. Also, MACD and DMI undeniably chose the bulls but hinted at a slight decrease in their power. Besides, an over 100% jump in trading volumes indicated a significant bullish move.
Litecoin (LTC)
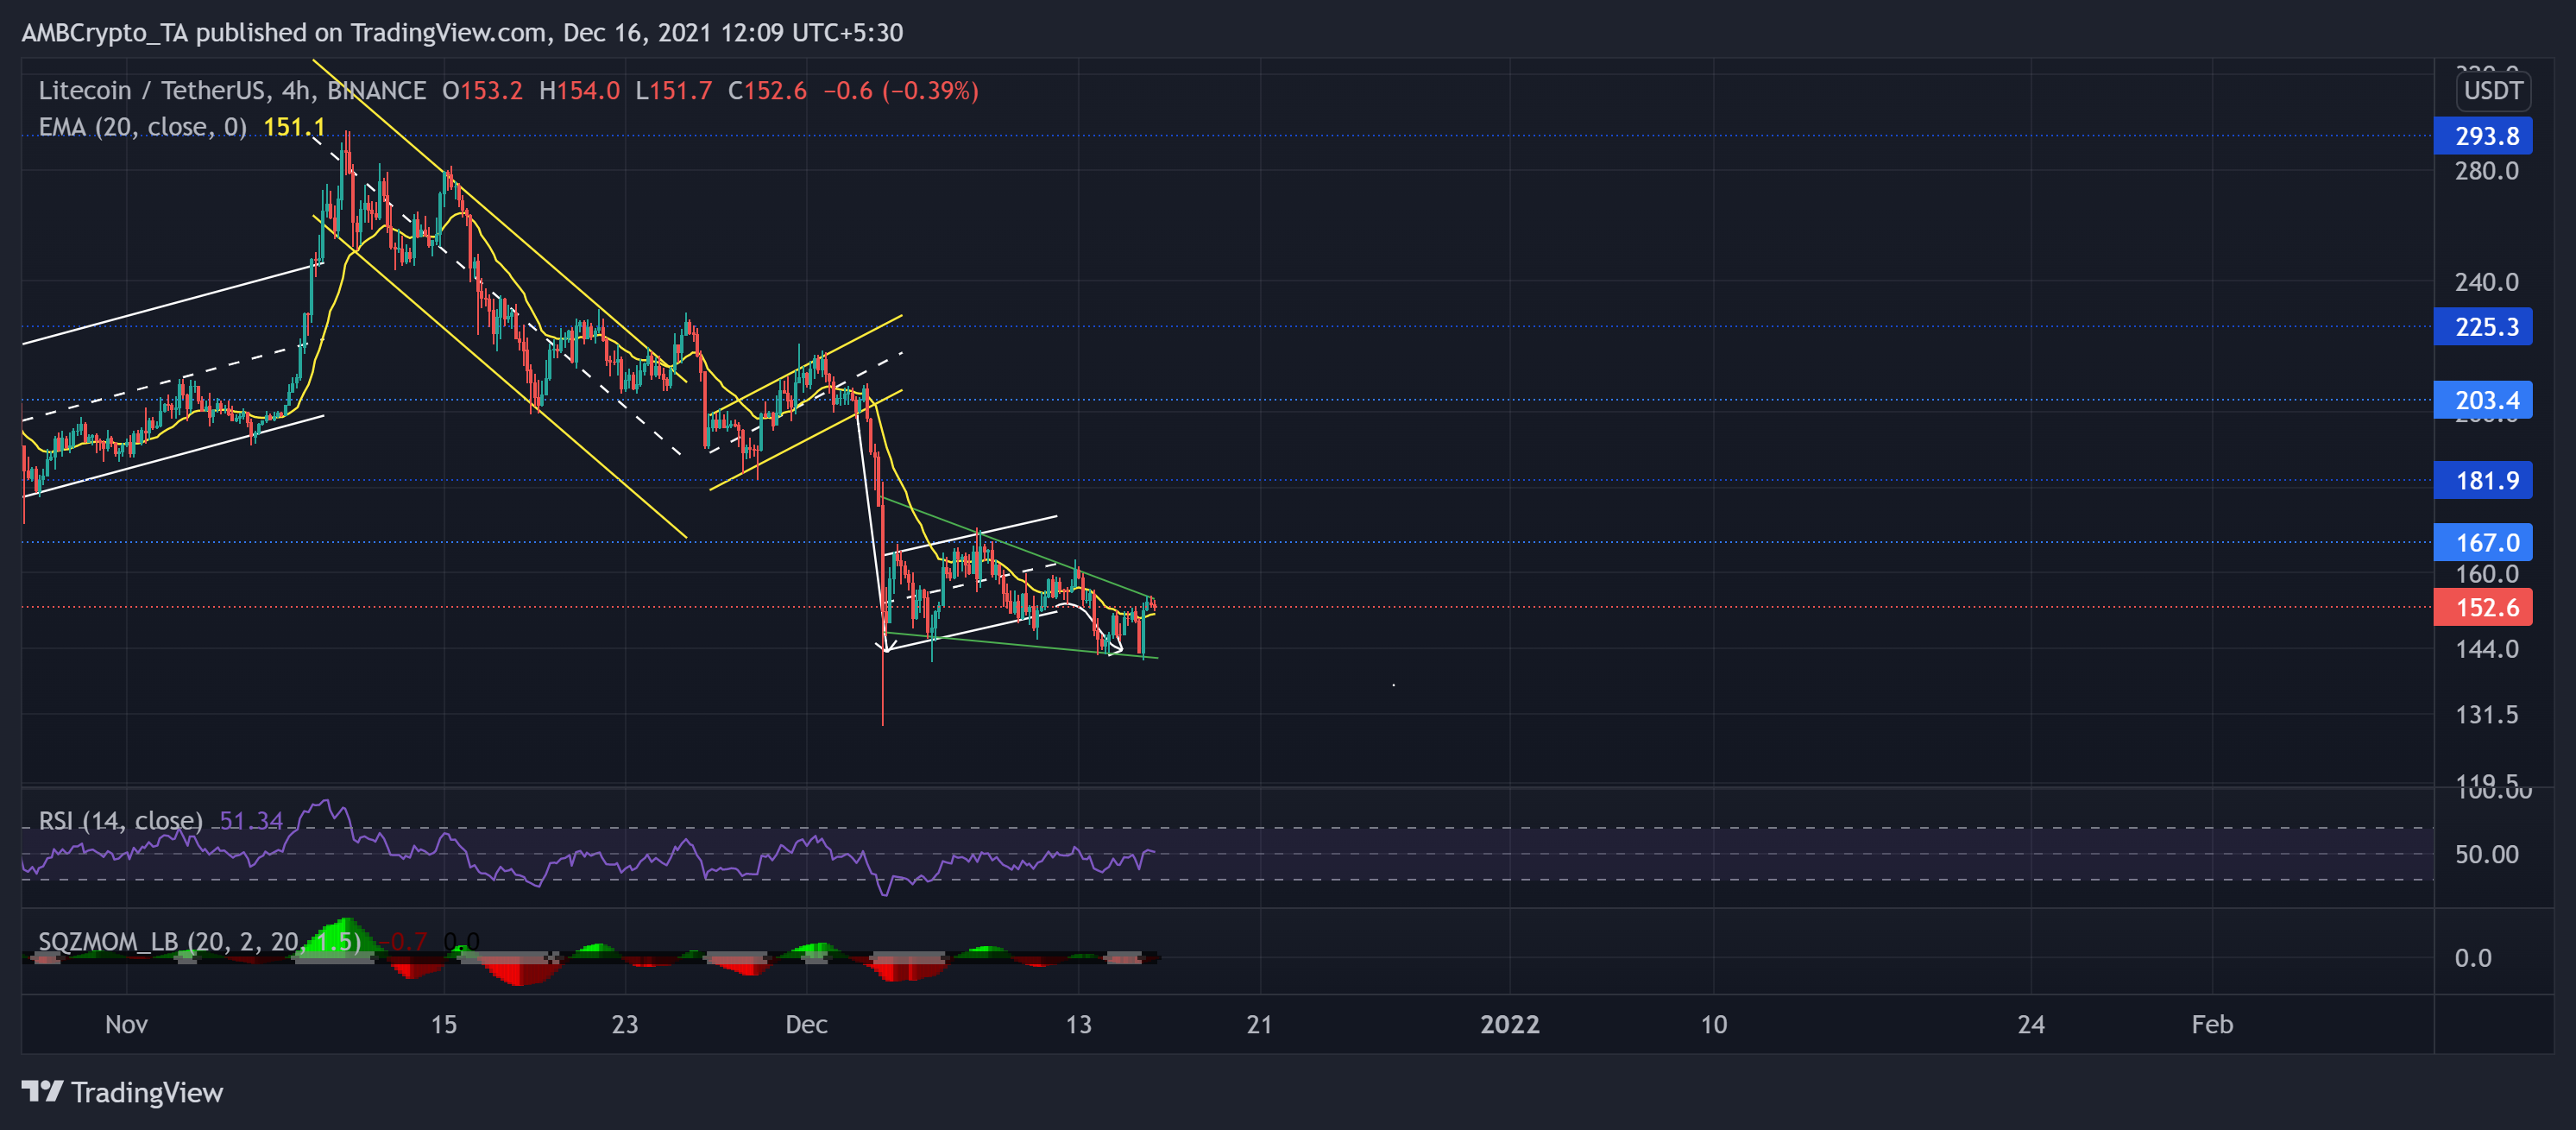
LTC fueled its bearish drift after an up-channel breakdown on 3 December as the price action moved below its 11-week resistance at the $167-mark. After forming a bearish flag, the bears retested the lower channel (white) twice before an up-channel breakdown.
Over the past 12 days, LTC formed a falling wedge (green) and hinted at a possible reversal. At press time, LTC traded at $152.6 after noting a 42.2% 30-day loss.
Except for a handful of times, the RSI stood below the midline for the past 30 days, visibly depicting the weak bullish power. Now, if the price falls below the 20-EMA (yellow), the lower trendline of the wedge stood as the immediate support. The Squeeze Momentum continued to hint at the squeeze phase with low volatility.
NEM
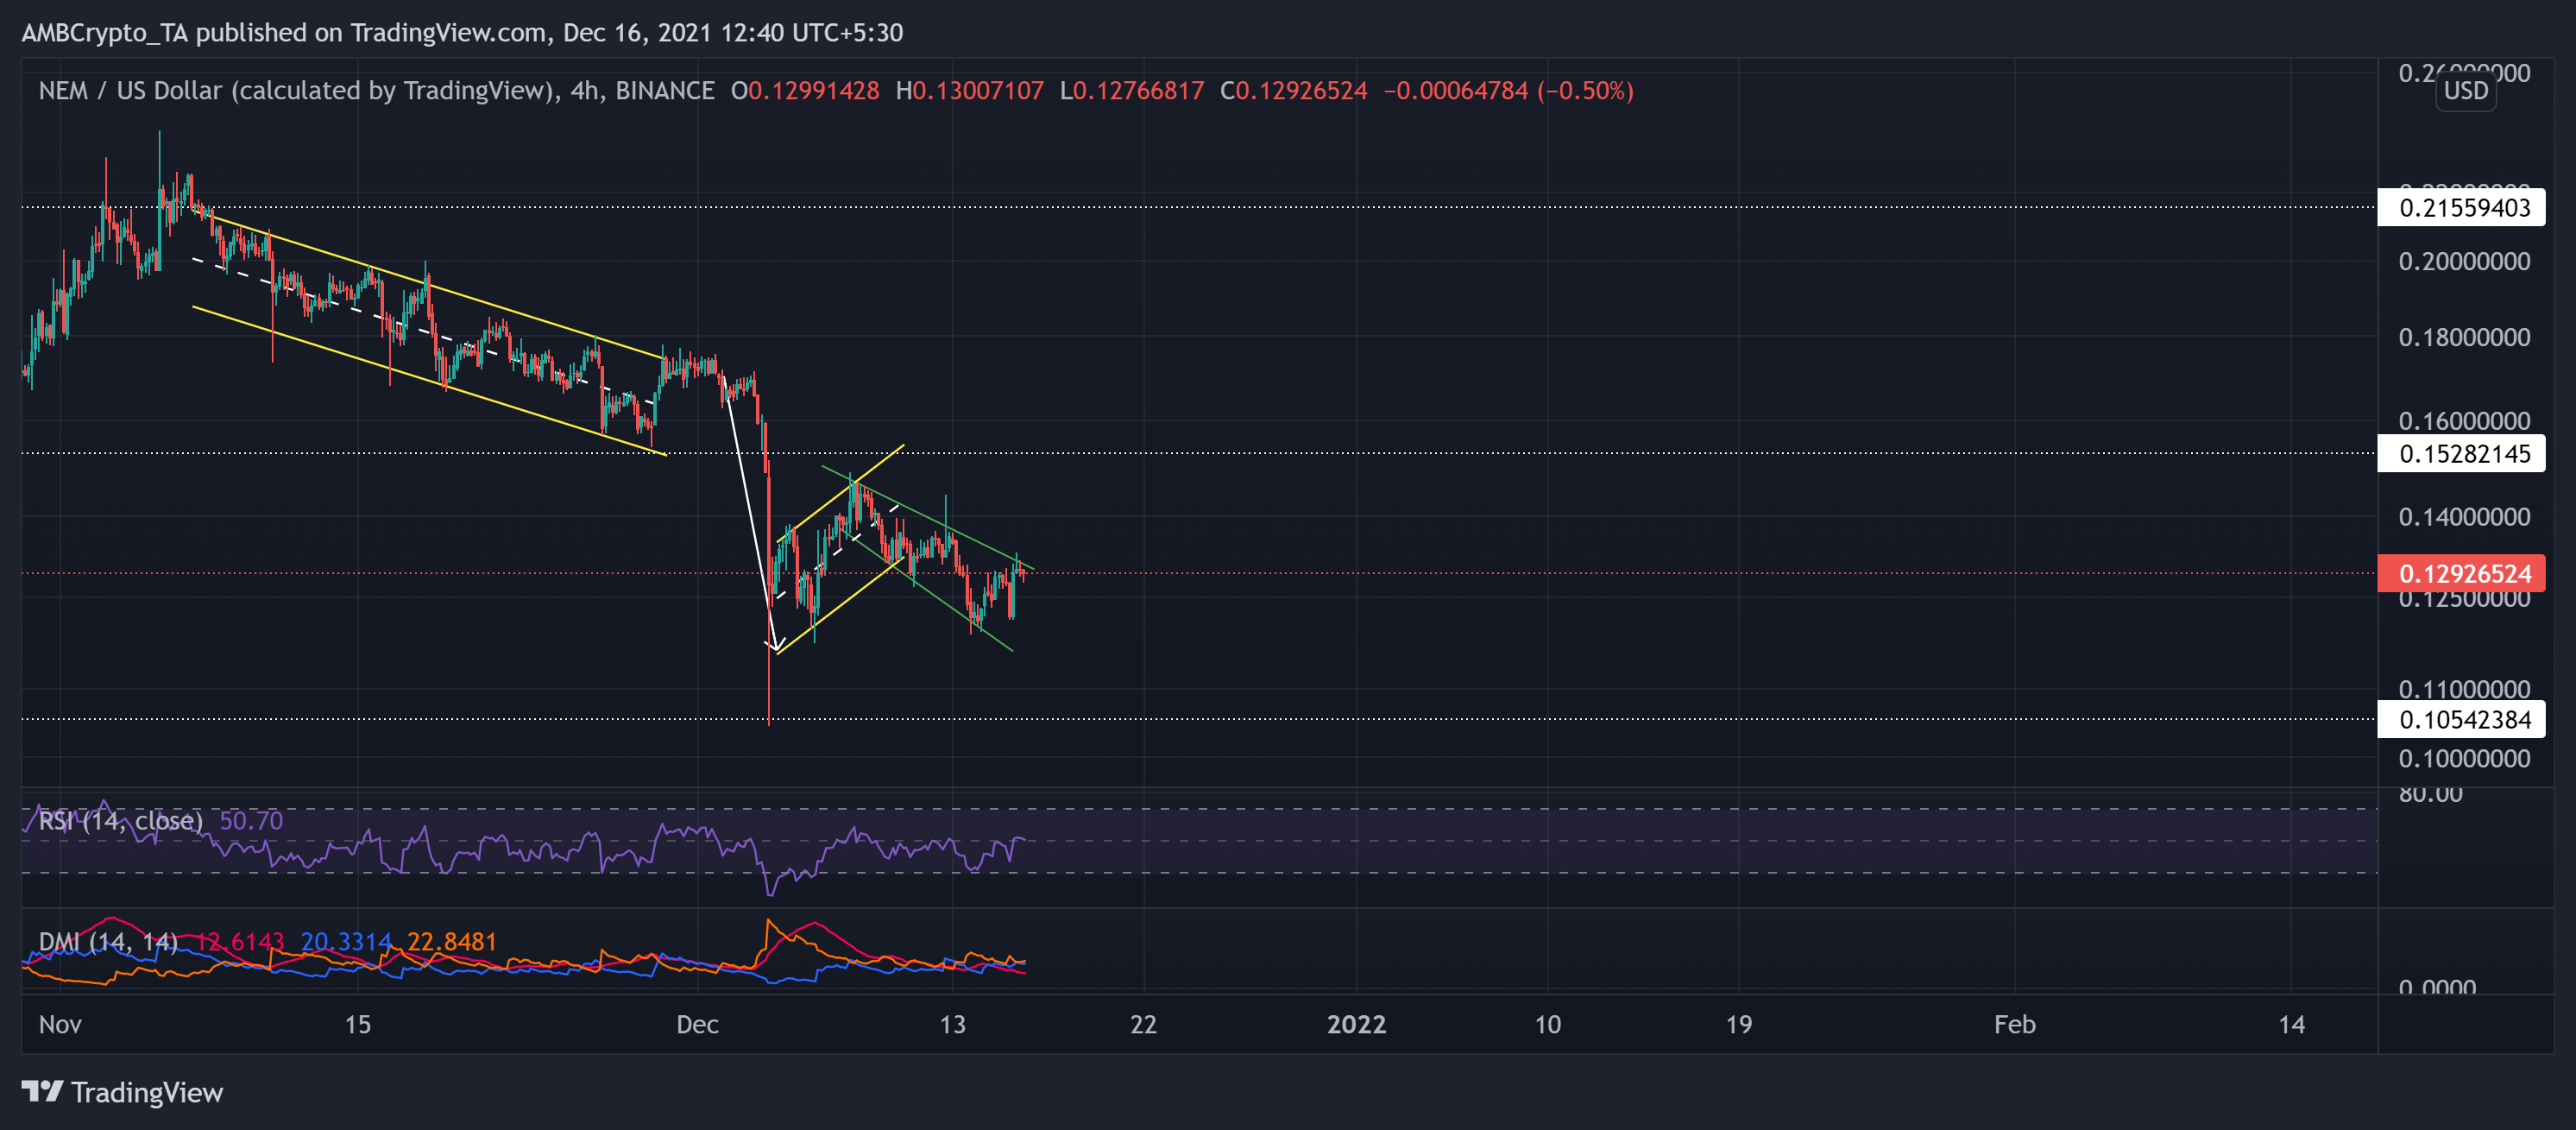
NEM steadily declined in a down-channel after striking its two-month high on 5 November. The altcoin lost more than one-third of its value in the next 25 days until a further breakdown occurred. It saw a sharp plunge toward its five-month low on 3 December.
After forming a bearish flag, the altcoin saw an expected breakout and formed a descending broadening wedge (green) over the past week. This movement hinted at a possible reversal after the near-term pullback phase.
At press time, NEM traded at $0.12927. The RSI struggled to waver above the midline after flashing neutral signals. On the DMI, the -DI line seemed to oppose the +DI line as they looked in the opposite direction. However, the ADX displayed a weak directional trend.