Avalanche, Litecoin, Stellar Price Analysis: 18 December
While the top altcoin was up by nearly 4.4% in 24 hours, Litecoin and Stellar marked similar daily gains on their charts at press time.
Avalanche continued its rally after seemingly leading the recovery phase.
Avalanche (AVAX)
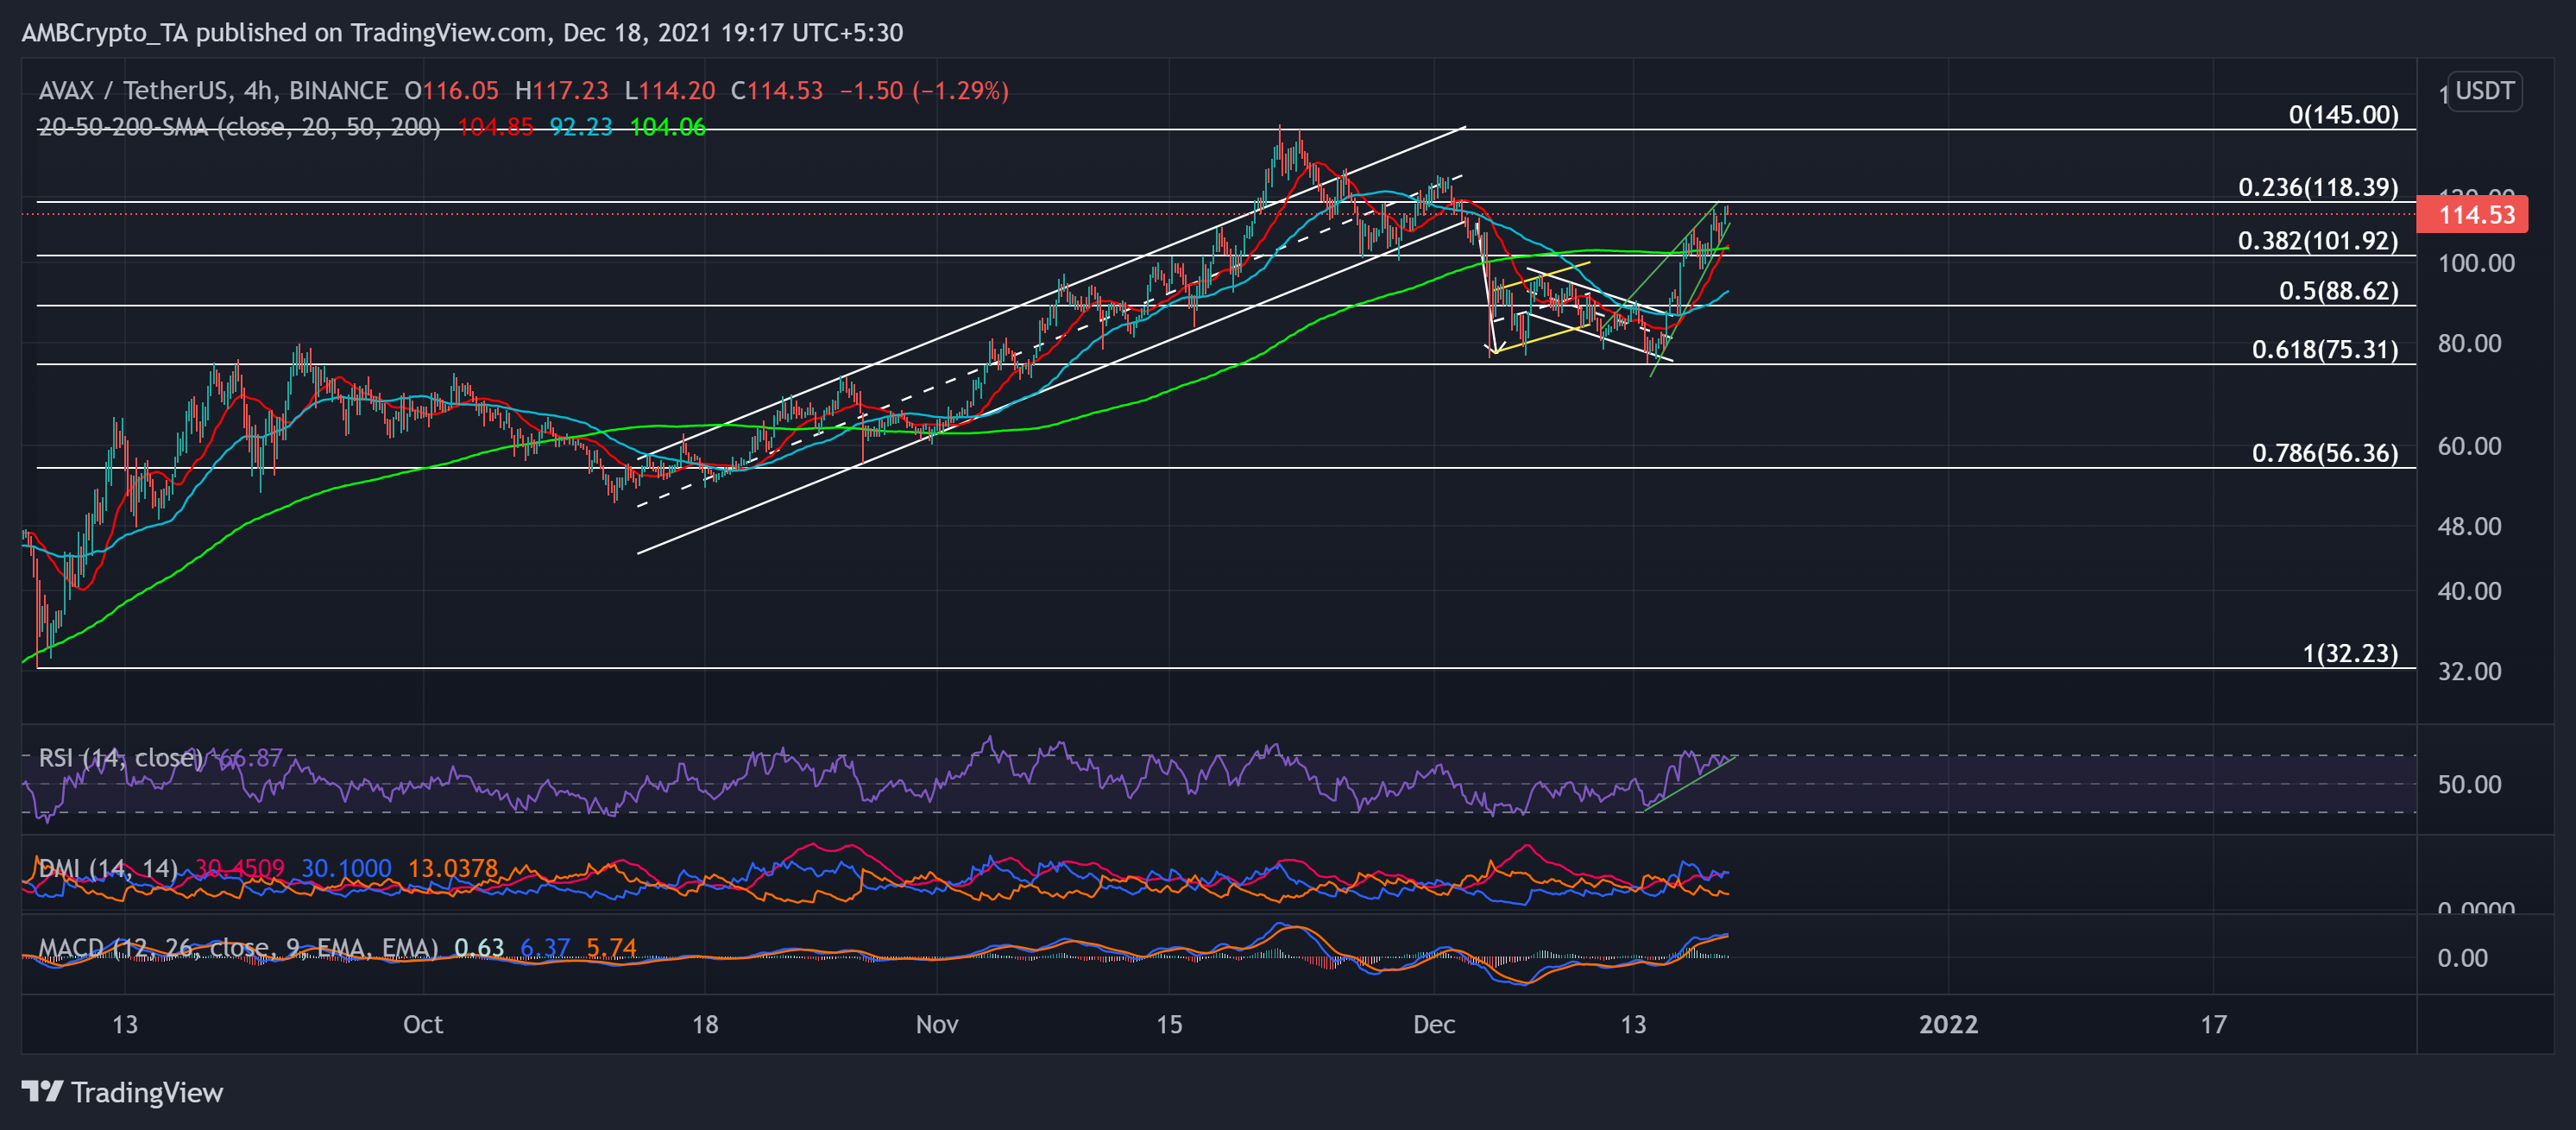
AVAX became one of the few cryptos that witnessed a soaring week. The crypto registered a staggering 42.1% seven-day ROI. Although it invalidated its long-term bullish trendline (since July), it bounced back the 61.8% golden Fibonacci level.
After a bearish flag breakdown, the alt formed a rising wedge and poked the $117-mark on 18 December. Now, any retracements from here would find testing support at the 38.2% Fibonacci point that stood just below its 20 (red) and 200 (green) SMA.
At press time, AVAX traded $114.53. The RSI retested the overbought region thrice and plunged towards the 66-level. Also, the DMI reaffirmed the superior bullish strength. Considering the reversal pattern and the overbought RSI threat, AVAX could see a near-term setback.
Litecoin (LTC)
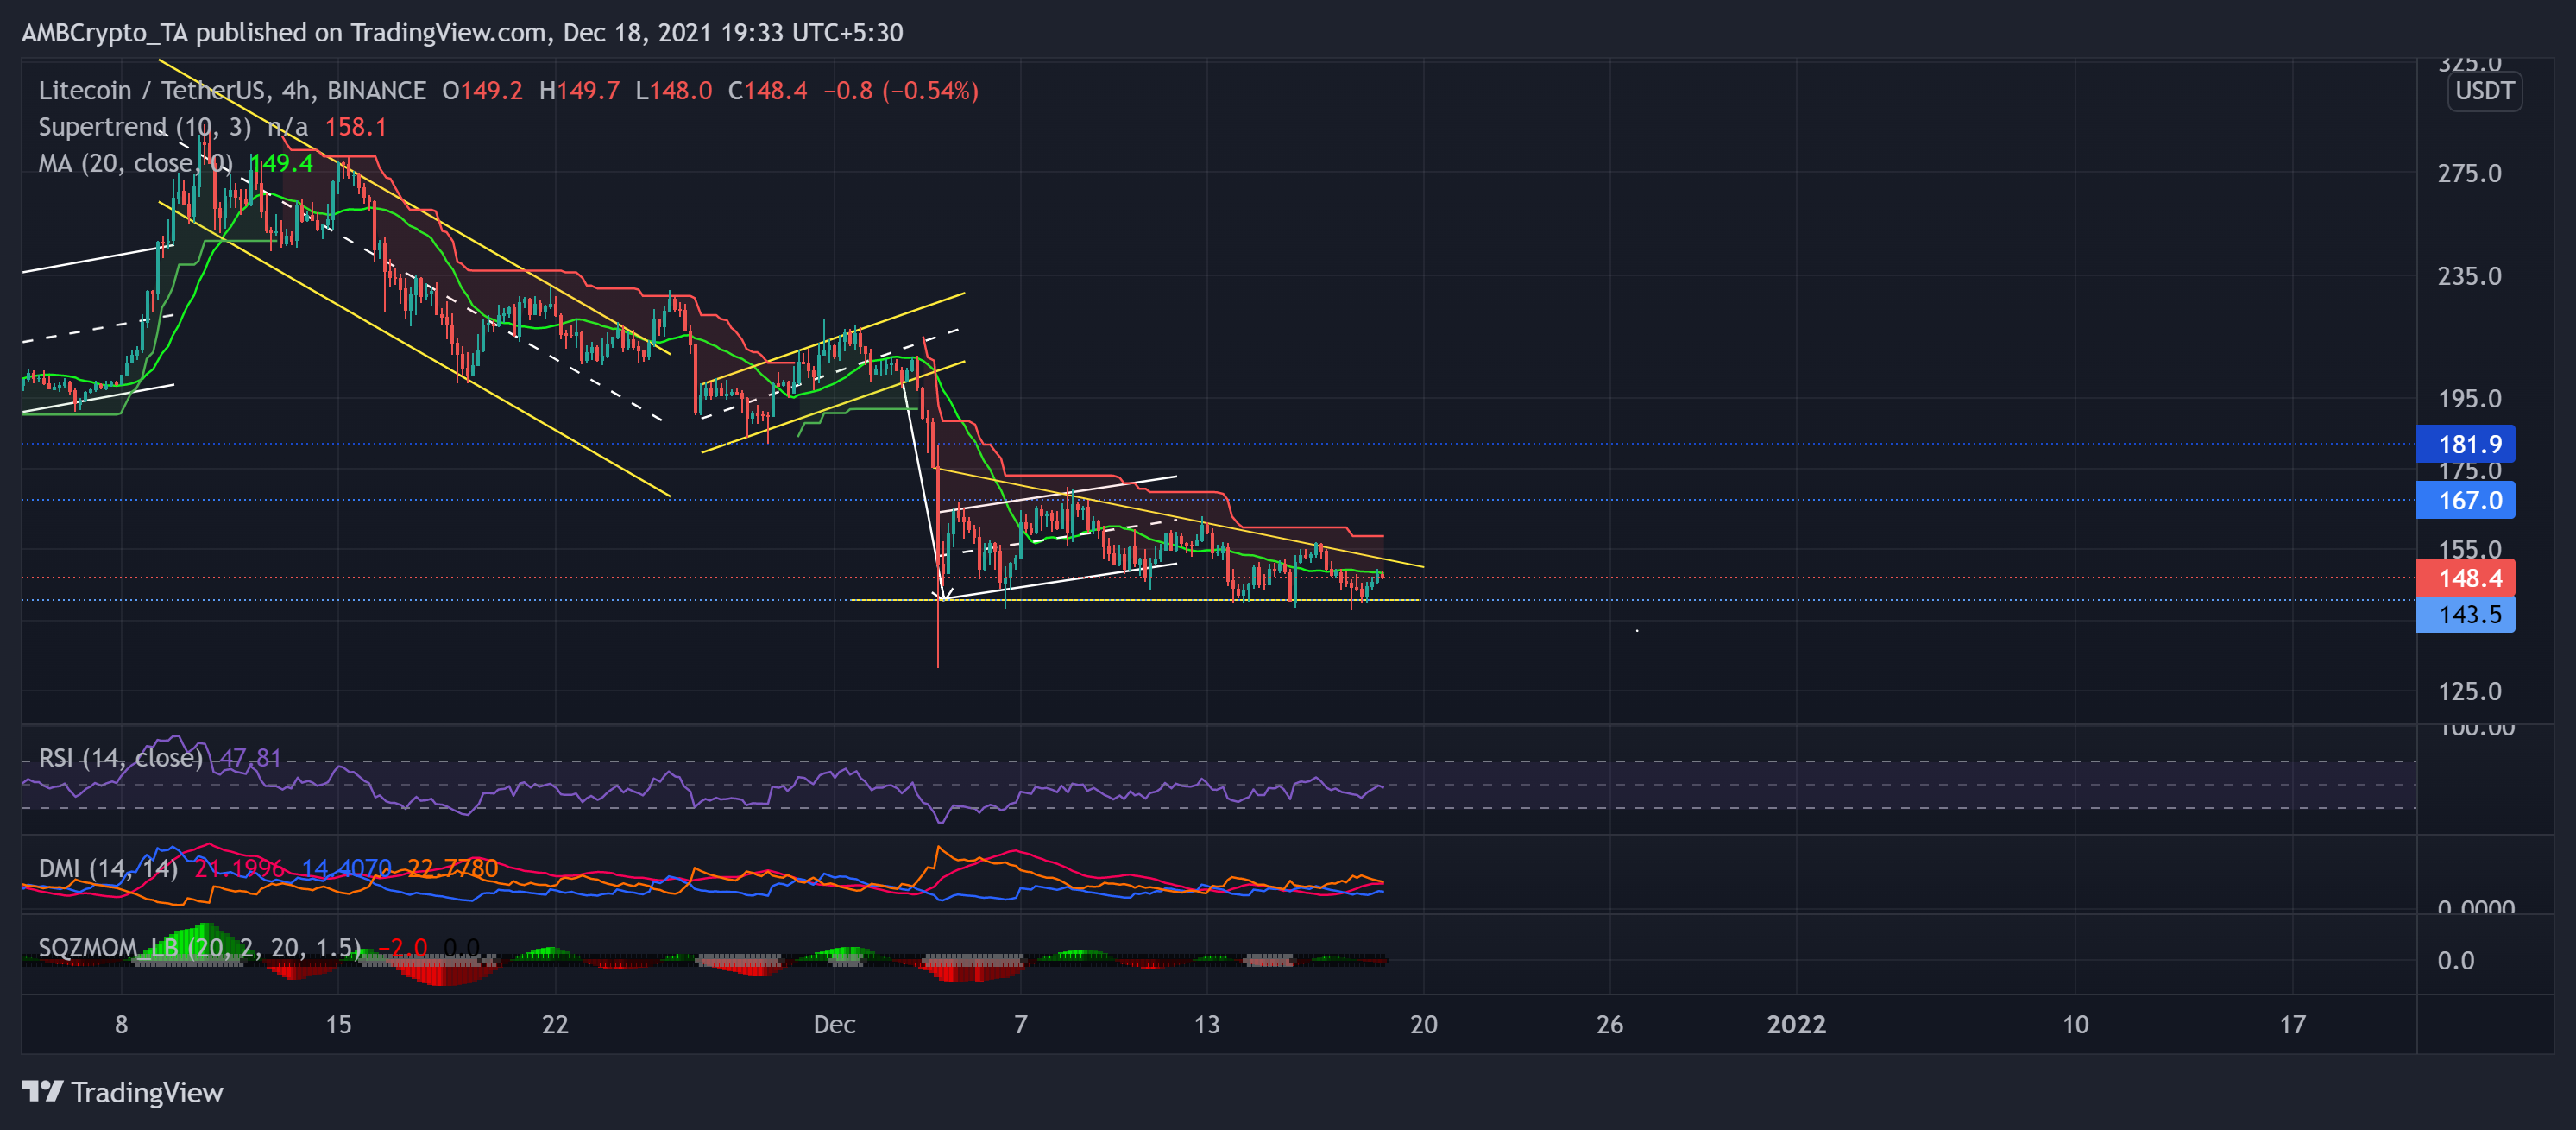
LTC mounted its bearish drift after an up-channel breakdown on 3 December as the price action moved below its 11-week resistance at the $167-mark. After forming a bearish flag, the bears retested the lower channel (white) twice before the breakdown.
Over the past 14 days, LTC formed a descending triangle by marking lower highs while maintaining the $143.5 support. Also, The Supertrend continued to flash a sell signal.
At press time, LTC traded at $148.4 after struggling to cross the 20-SMA (red) hurdle. Except for a few times, the RSI stood below the half-line for the past 30 days, visibly depicting the weak bullish power. Also, the DMI confirmed the bearish bias but displayed a slightly weak directional trend. The Squeeze Momentum continued to hint at the squeeze phase with low near-term volatility.
Stellar (XLM)

After an up-channel breakdown on 3 December, XLM too formed a descending triangle depicting a strong selling influence. It persistent marked lower highs while maintaining the $0.24 support. The alt registered an over 18% 15-day decline.
Since the massive sell-off on 3 December, XLM’s 50-SMA (green) stood as strong resistance as the price action constantly obliged the same.
At press time, XLM traded at $0.26046. The RSI failed to sustain itself above the half-line and displayed weak signs. The DMI visibly chose the sellers while the ADX displayed a weak directional trend.