Analysis

Avalanche Volume Profile shows two critical resistances for bulls to overcome
Posted:
Journalist

Disclaimer: The information presented does not constitute financial, investment, trading, or other types of advice and is solely the writer’s opinion.
- The short-term range showed confluence with the volume profile tool.
- Avalanche bears have been strong in the $18 area.
Avalanche traded within a range on the price charts, and the $16.4 support zone has been defended multiple times in March. The halted block production on 23 March saw AVAX bulls stopped near the $17.6 zone.
Read Avalanche’s [AVAX] Price Prediction 2023-24
Bitcoin has also traded within a range over the past week, and its price action could heavily influence the direction of Avalanche. As things stand, AVAX short sellers could watch out for a selling opportunity in case of a move upward.
The confluence of range highs and Value Area Highs could entice bears
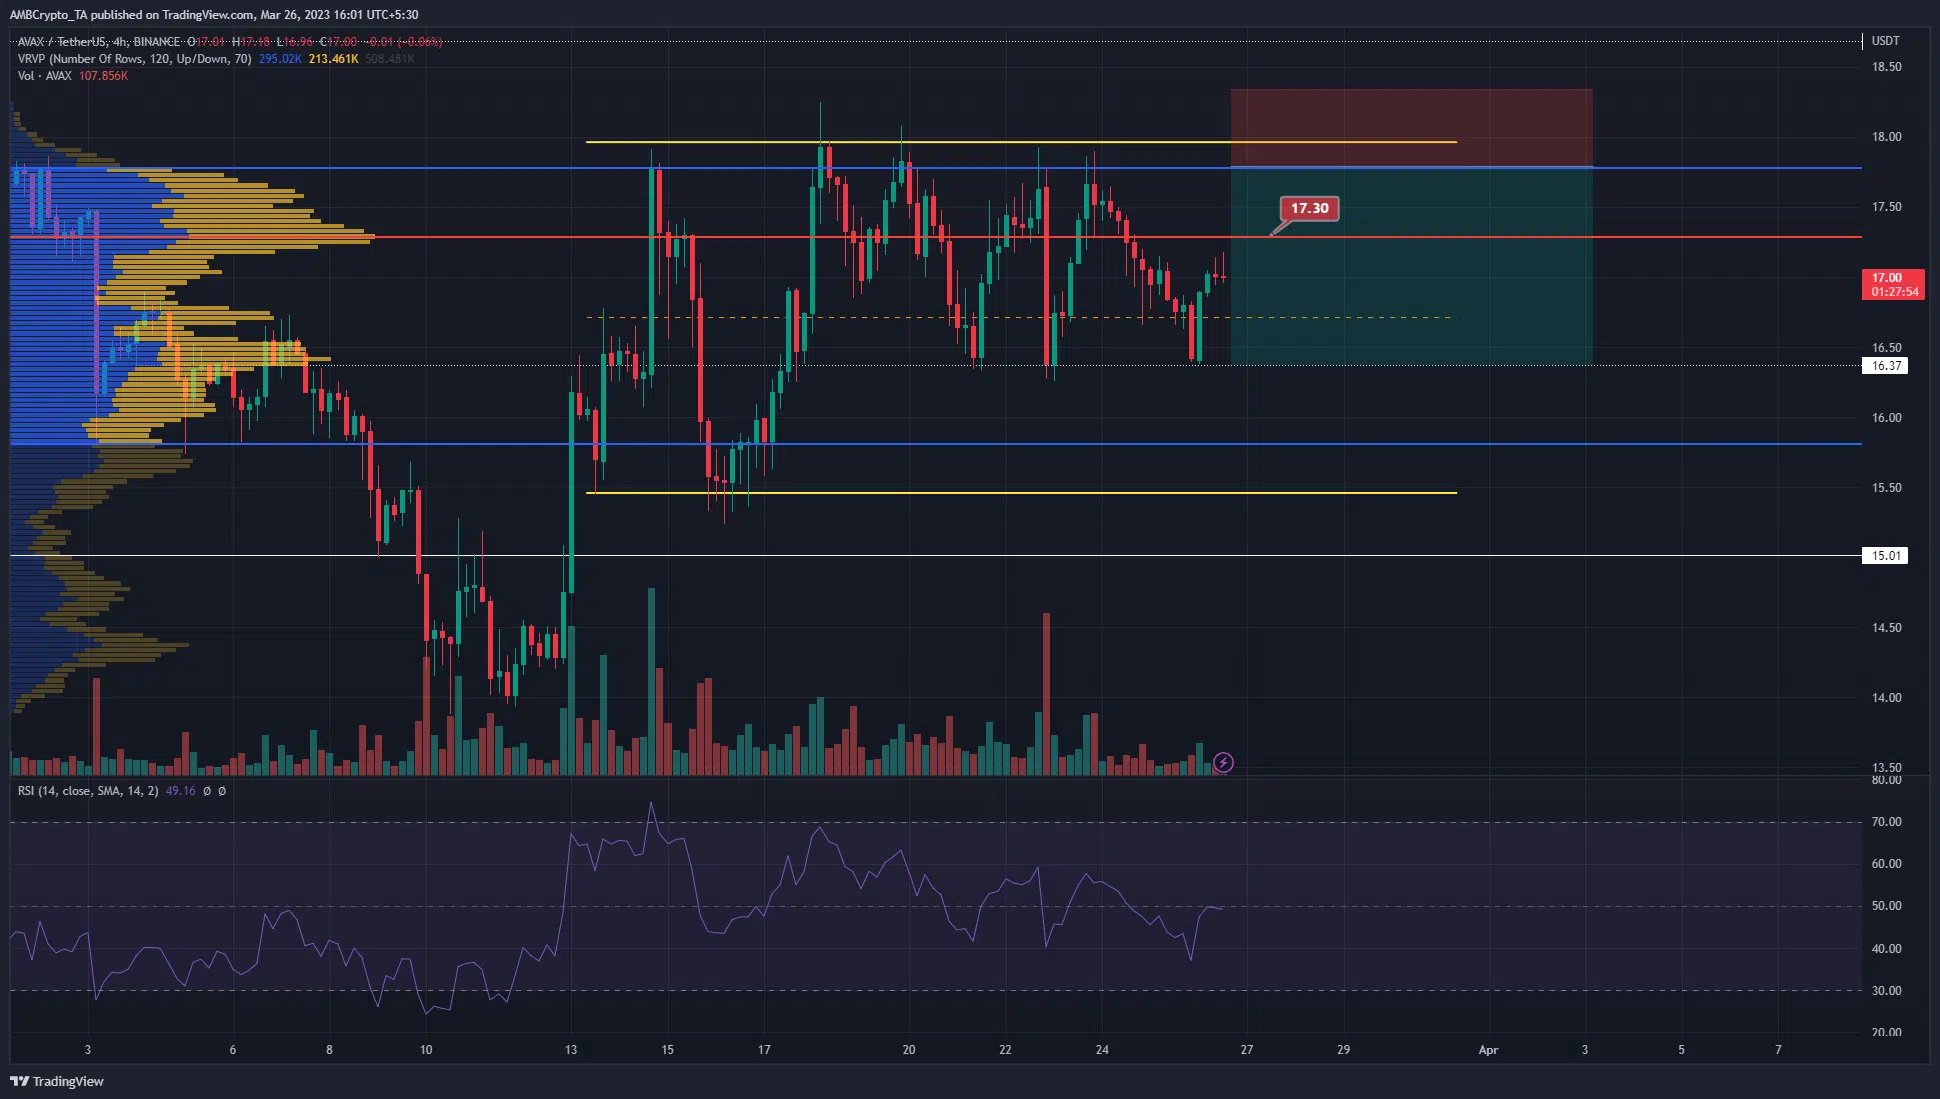
Source: AVAX/USDT on TradingView
The Volume Profile Visible Range tool showed the Point of Control (red) to lie at $17.3. This marked it as the point where the most volume of trading occurred in the visible range, which extended back to early March.
The Value Area High was at $17.8 and the Value Area Low was at $15.8. Moreover, AVAX traded within a range (yellow) that extended from $15.47 to $18. The horizontal level at $16.37 and the mid-range level at $17.73 have acted as support over the past few days.
At the time of writing, Avalanche saw another bounce from the support level. This could see the price ascend toward the $18 resistance. In that scenario, short sellers can look for rejection on lower timeframes before entering short trades.
Is your portfolio green? Check the Avalanche Profit Calculator
Invalidation of this bearish notion would be a session close above $18.3. The bearish targets are the $16.4 support zone and the range lows at $15.5, but the latter could be an ambitious target.
Spot CVD showed signs of recovery after a long downtrend
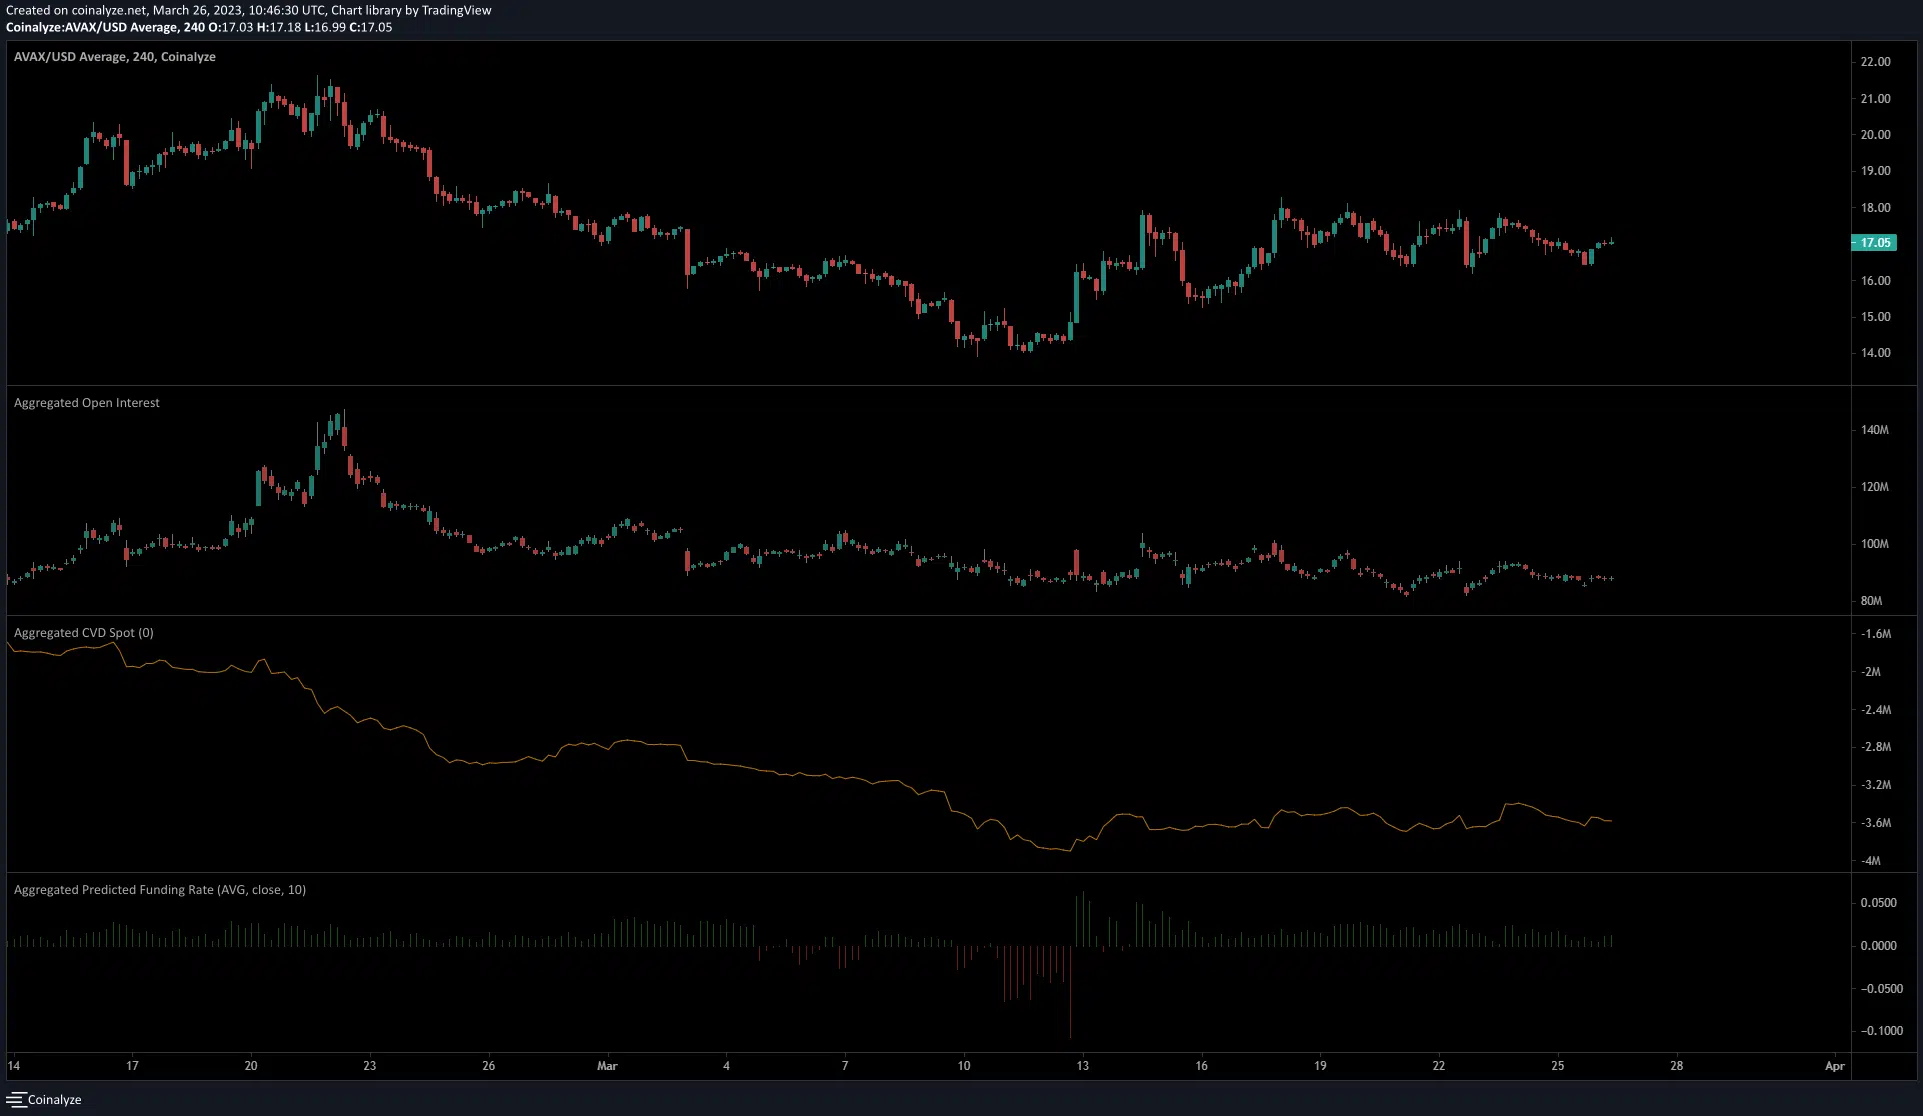
Source: Coinalyze
The predicted funding rate was barely positive which showed the market sentiment was only weakly bullish. The spot CVD saw a minor bounce after weeks of a downtrend, which indicated that buying pressure was present but not dominant.
The fact which would encourage bulls was the steady decline in Open Interest since mid-March. Each bounce in AVAX prices saw weaker and weaker bounces on the OI, which showed fewer bullish speculators over time. This was a sign of bearish sentiment.