Altcoin
Avalanche: What you need to know about AVAX as network activity craters
While subnets boosted network activity in April, Avalanche began to see a decline in daily active addresses and transactions in the last month.

- Network activity on Avalanche suffers decline after seeing growth in April.
- Liquidity exit pushes AVAX’S price downwards.
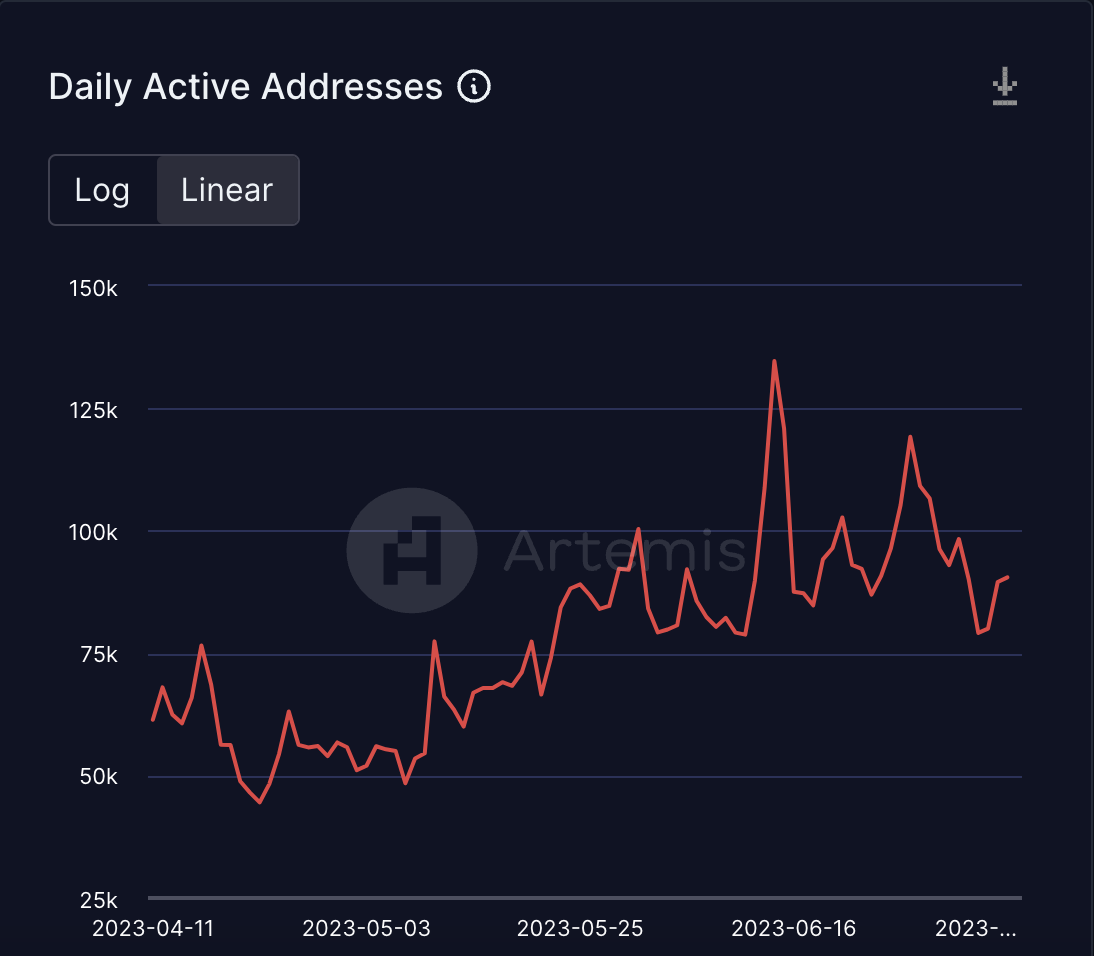
Network activity on Avalanche [AVAX] has plummeted significantly in the last month as the count of daily active addresses and transactions completed on the Layer 1 (L1) blockchain dwindles.
Is your portfolio green? Check out the Avalanche Profit Calculator
This decline came after the network recorded a surge in active wallets in April following an aggressive deployment of a number of Avalanche subnets.
According to data from Artemis, the number of unique wallet addresses sending on-chain transactions daily on Avalanche has dropped consistently since 14 June. At a daily active address count of 90,500 on 8 July, this has since declined by 33%.
As a result of a fall in active addresses, the number of transactions completed on Avalanche has also dipped. However, the fall in daily transactions count on the chain dates back to 20 May. Per data from Artemis, daily transactions on Avalanche have since decreased by 52%.
In addition to a steep decline in network activity, DeFi on the chain has also taken a beating. Since the beginning of Q2, the total volume of transactions completed through on-chain decentralized exchanges (DEXes) housed within Avalanche has declined.
This resulted in a corresponding fall in network TVL during the same period. At $686.53 million, Avalanche’s TVL has dipped by 25% since April. Per data from DefiLlama, the chain’s TVL has fallen by 10% this year alone.
Read Avalanche’s [AVAX] Price Prediction 2023-24
AVAX trades lower
At the time of writing, AVAX exchanged hands at $13.35 per token. Data from
CoinMarketCap revealed that in the last week, AVAX rallied to a high of $14.12 on 9 July before embarking on a downtrend.A look at price movements on a daily chart revealed that the week might be marked by a further decline in AVAX’s value. For example, an assessment of AVAX’s Bollinger Bands indicator revealed the alt’s price trading by the upper band. In situations like this, the asset is considered to have reached an overbought condition. Traders and analysts often interpret this as a potential signal of a price reversal or a period of consolidation.
Moreso, AVAX’s Chaikin Money Flow posted a negative value of -0.04 at press time. This signaled that AVAX distribution exceeded its accumulation, and the liquidity needed to drive up the asset’s value was being removed by traders.
Lastly, the Directional Movement Index suggested that sellers were gearing up to overrun the market. The negative directional index (red) was in an uptrend, poised to rest above the positive directional index (green).


