
- Avalanche entered into a relatively high volatility zone after witnessing a strong bearish edge.
- The crypto’s bull vs bear indicator showed some hopes for revival.
Soon after touching its nearly two-year high in March 2024, Avalanche [AVAX] took a bearish trajectory and was on a downtrend. The altcoin’s steep bearish rally pulled AVAX below some crucial levels, one of which was the 200-day EMA level on the daily chart.
At the time of writing, AVAX was trading at $25.6, down by nearly 3% over the past day. The coin could now see a highly volatile move from its press time levels, especially as it oscillated in a relatively low liquidity zone.
AVAX fell below its 200-day EMA
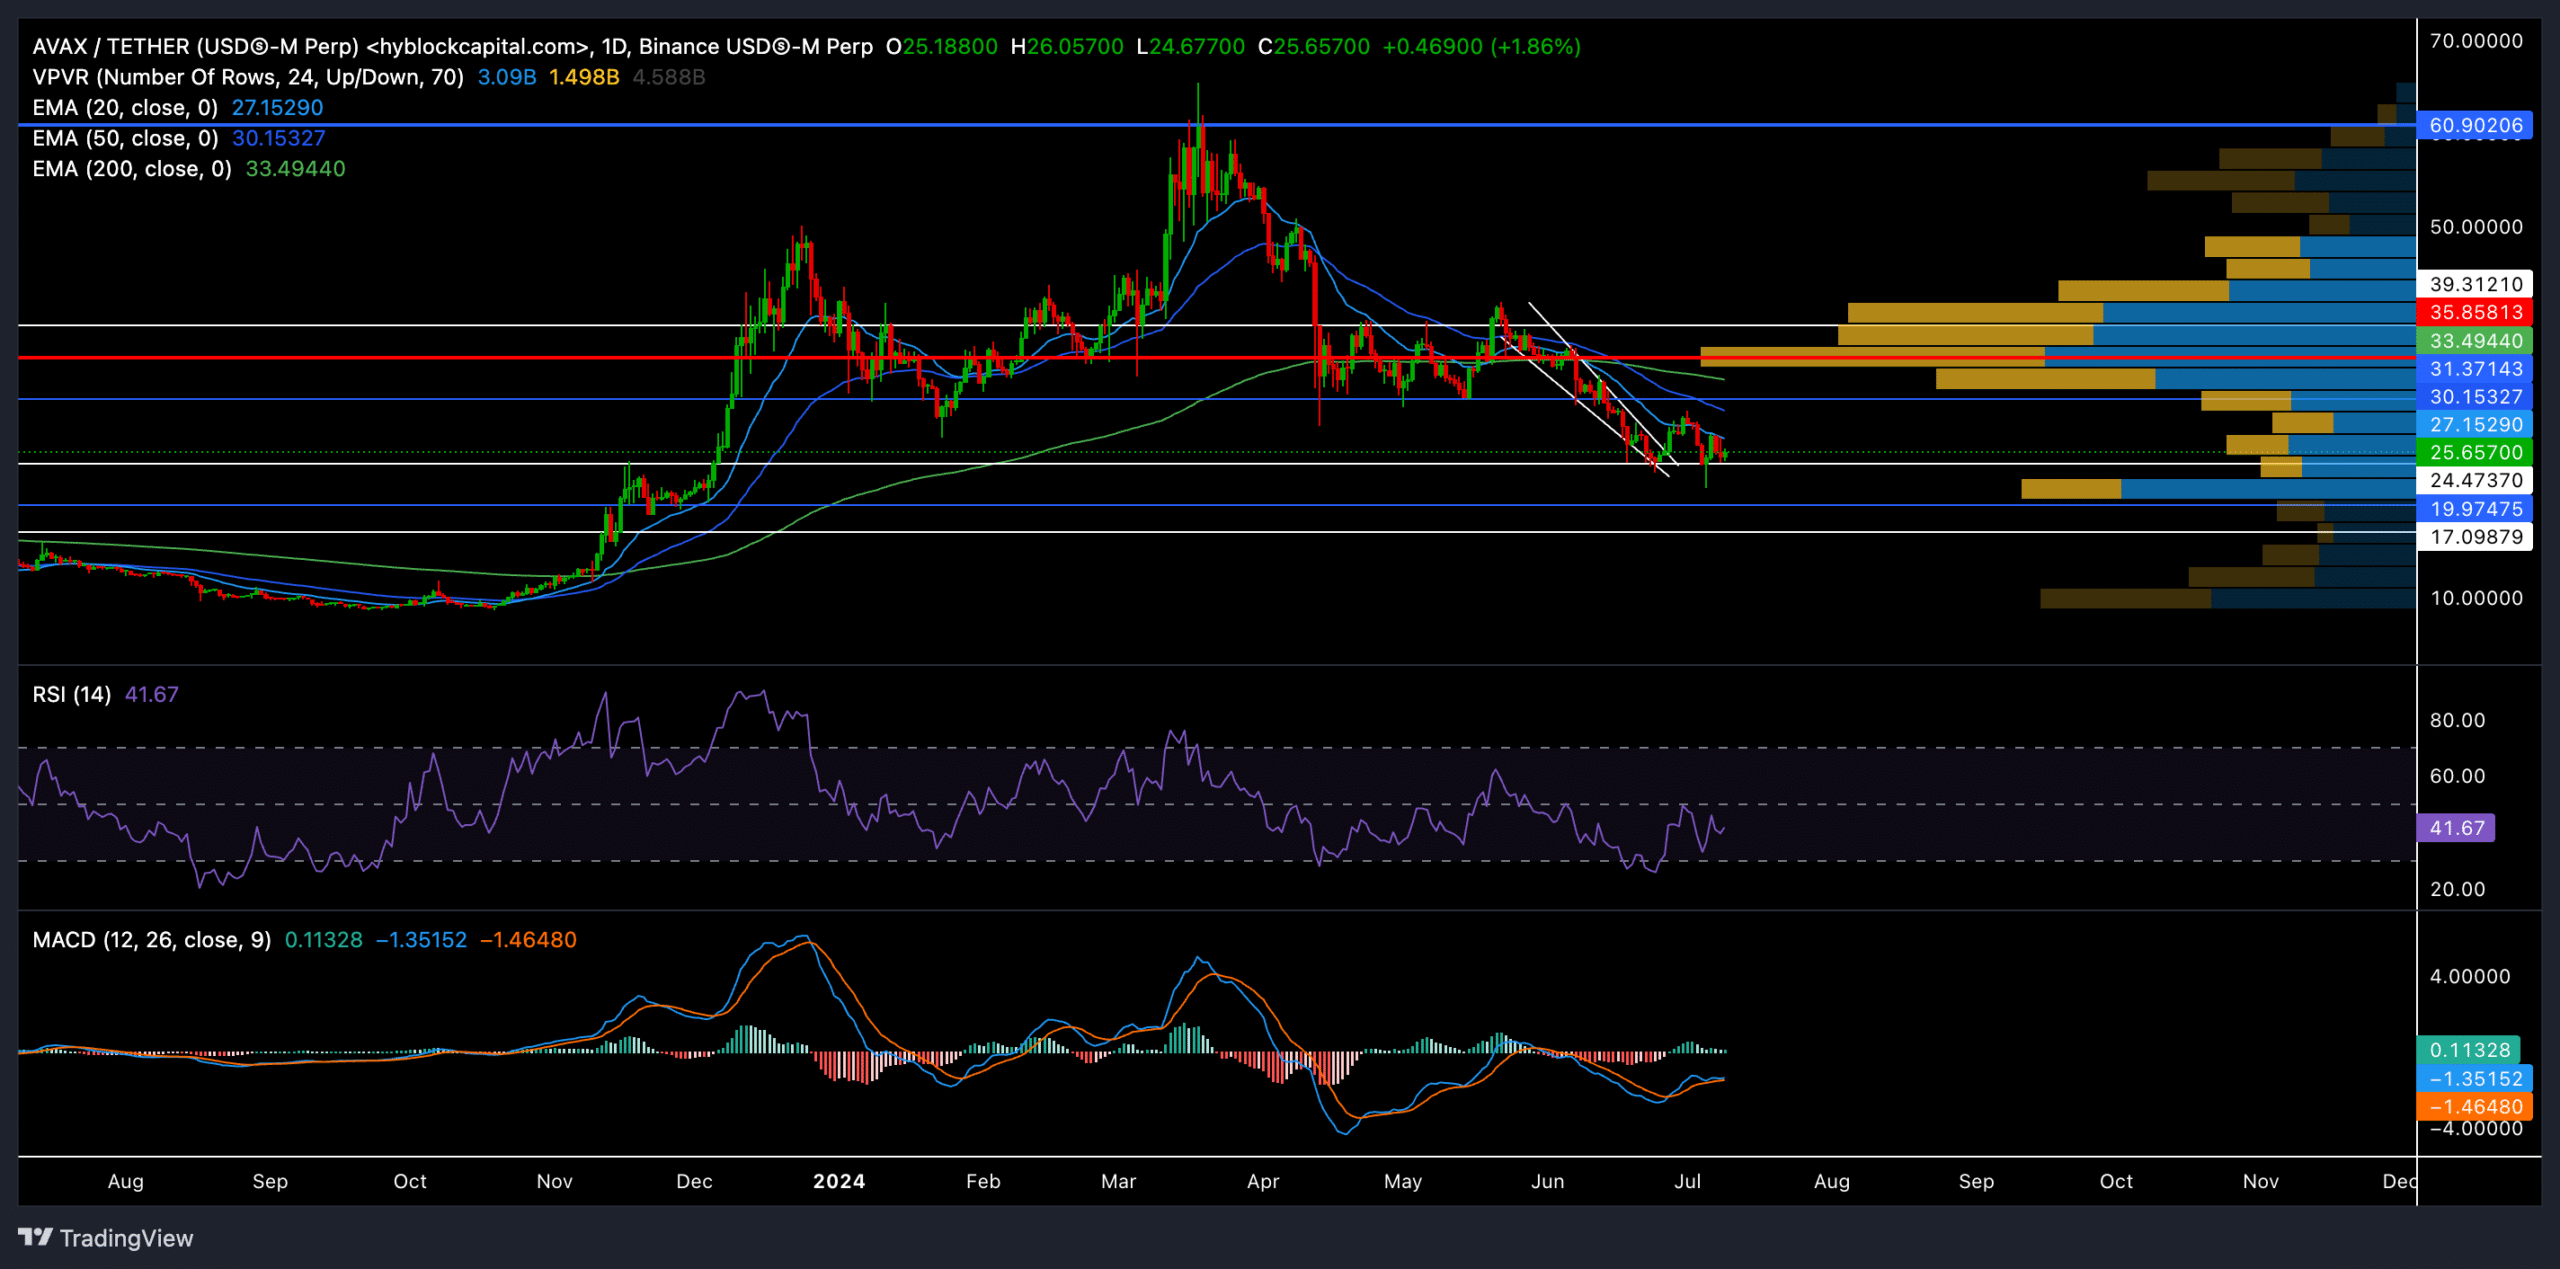
After witnessing a rather extended uptrend in its rally from October 2023 to March 2024, AVAX grew by nearly 585% and retested the $61 resistance. It touched its two-year high of $64.5 during this rally on 18th March.
However, the altcoin witnessed a streak of red candles on its chart and kept losing important support levels. One major level was the Point of Control (POC, red) line of the volume profile visible range.
Since it represents the level with the most liquidity over the past year, we can see how AVAX entered a consolidation phase in the $31-$40 range for nearly two months (April to June).
However, the sellers kept exerting more pressure as the coin continued to chalk out a classic falling wedge pattern on the daily chart.
Finally, the $24.4 level reignited a bullish rebuttal over the past few weeks. As a result, AVAX saw a bullish breakout, but the 20 EMA continued to pose near-term recovery hurdles.
With the death cross on the EMAs (20 and 50 EMAs crossing below 200 EMA), the sellers would aim to curb any immediate buying rallies.
A potential decline below the $24 support can set the stage for the sellers to continue their bearish trend. They could look to test the $17-$19 support range should the altcoin fail to uphold the immediate support level.
It’s worth noting that any potential jump above the 20/50 EMAs can help the buyers regain some strength, but the 200 EMA would likely act as a strong resistance.
The Relative Strength Index (RSI) continued to show an edge for the sellers as it struggled to cross the 50 level. Similarly, the MACD reaffirmed the bearish edge as it was yet to find a close above its equilibrium.
Is your portfolio green? Check the Avalanche Profit Calculator
Bulls vs bears

Source: IntoTheBlock
According to IntoTheBlock’s data, AVAX still showed net buying activity by large players. Its seven-day bulls (147) exceeded the bears (142) per the platform.
The platform categorizes those who bought more than 1% of the total volume as ‘bulls’ and those who sold more than 1% as ‘bears.’
This showed some positive sentiment among large buyers— potentially helping the altcoin reclaim its bullish edge.


