
Ethereum ETFs see $1.85B inflows – 25x more than Bitcoin!
- Avalanche has a bullish market structure on the daily chart.
- The technical indicators showed a buy signal, traders can await a retest of this demand zone.
Avalanche [AVAX] saw a breakout past a multi-month descending channel. It also cleared a stern resistance zone at the $24 region and is likely to flip this area to a demand zone where the next rally can be initiated.
A recent report noted that a price breakout could see gains of 100%, presenting a price target of $71 in the coming months. The weekly and 3-day charts highlighted a key resistance zone well before this target of $71 that could impede the buyers.
The bullish prospects for Avalanche were brightening
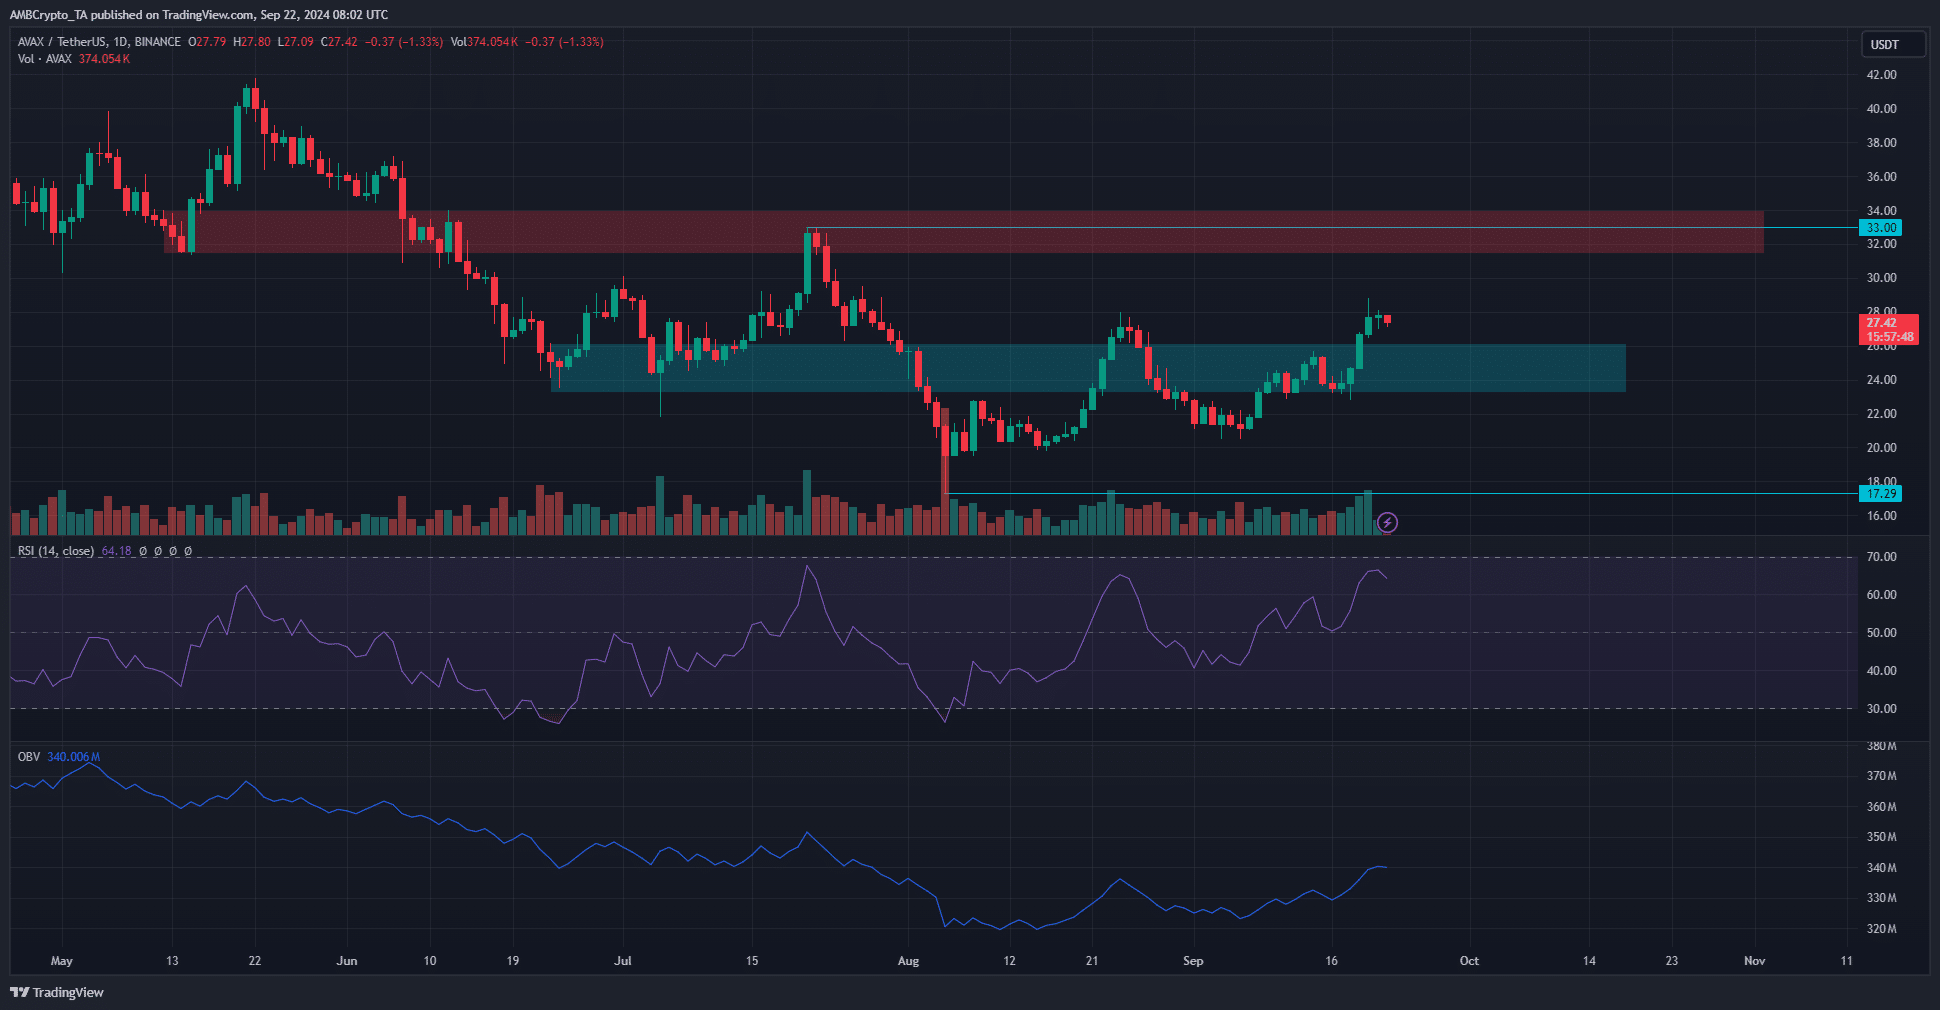
Source: AVAX/USDT on TradingView
On the daily chart, the token has a bullish market structure. The daily RSI showed strong bullish momentum and did not exhibit a divergence yet, which would be a signal of a potential price reversal.
The $33 and $17.29 were the levels of importance on the weekly timeframe. At the $33 level was a bearish breaker block on the 3-day timeframe, marking it as a strong resistance zone. The $23.3-$26 zone is a bullish order block on the 3-day chart.
Therefore, a retest of the $24 region should present swing traders with a buying opportunity. The OBV has been trending higher over the past month to indicate bullish strength in the market.
Sentiment began to shift bullishly
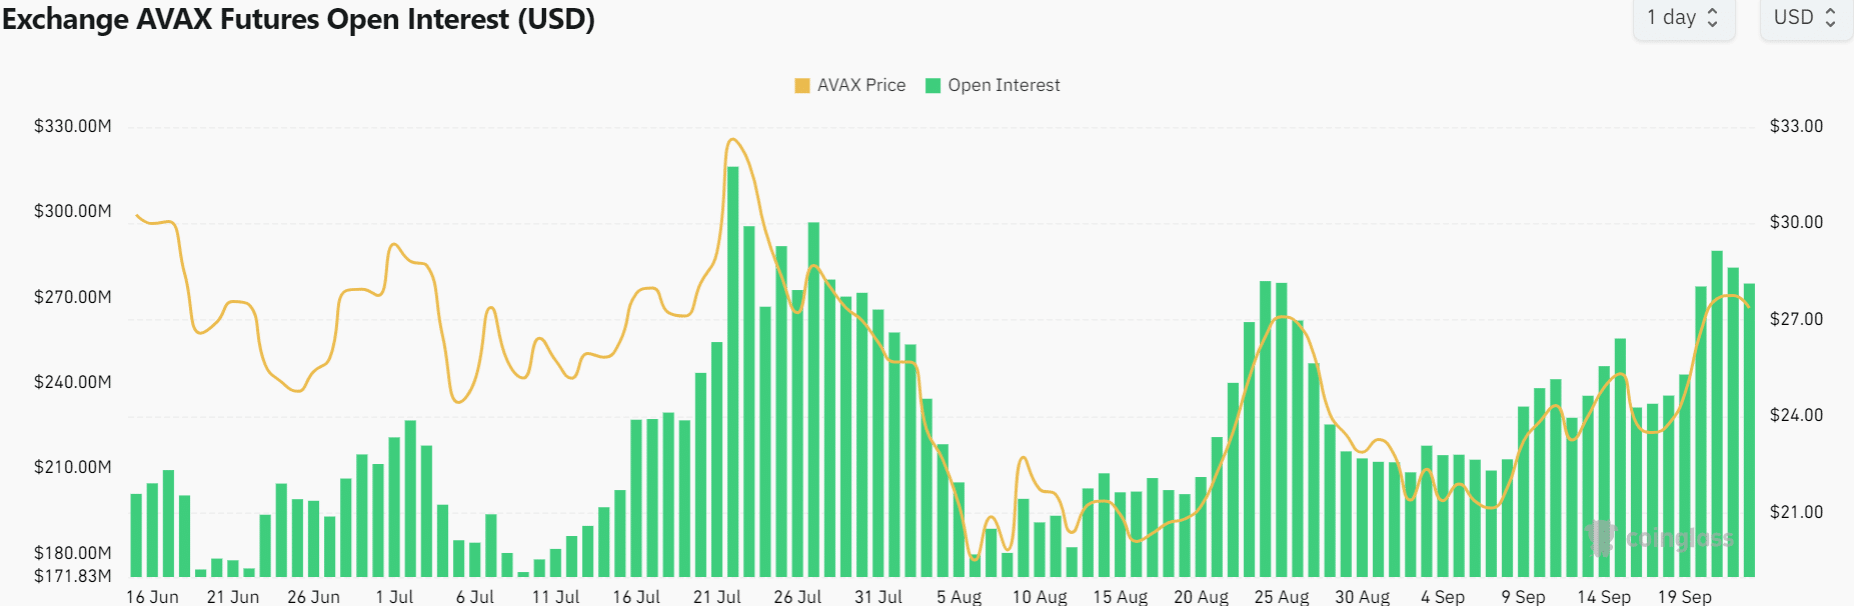
Source: Coinglass
The Open Interest has been trending higher in September and showed increased confidence among speculators. This readiness to go long was due to the steady price gains of AVAX in recent weeks.
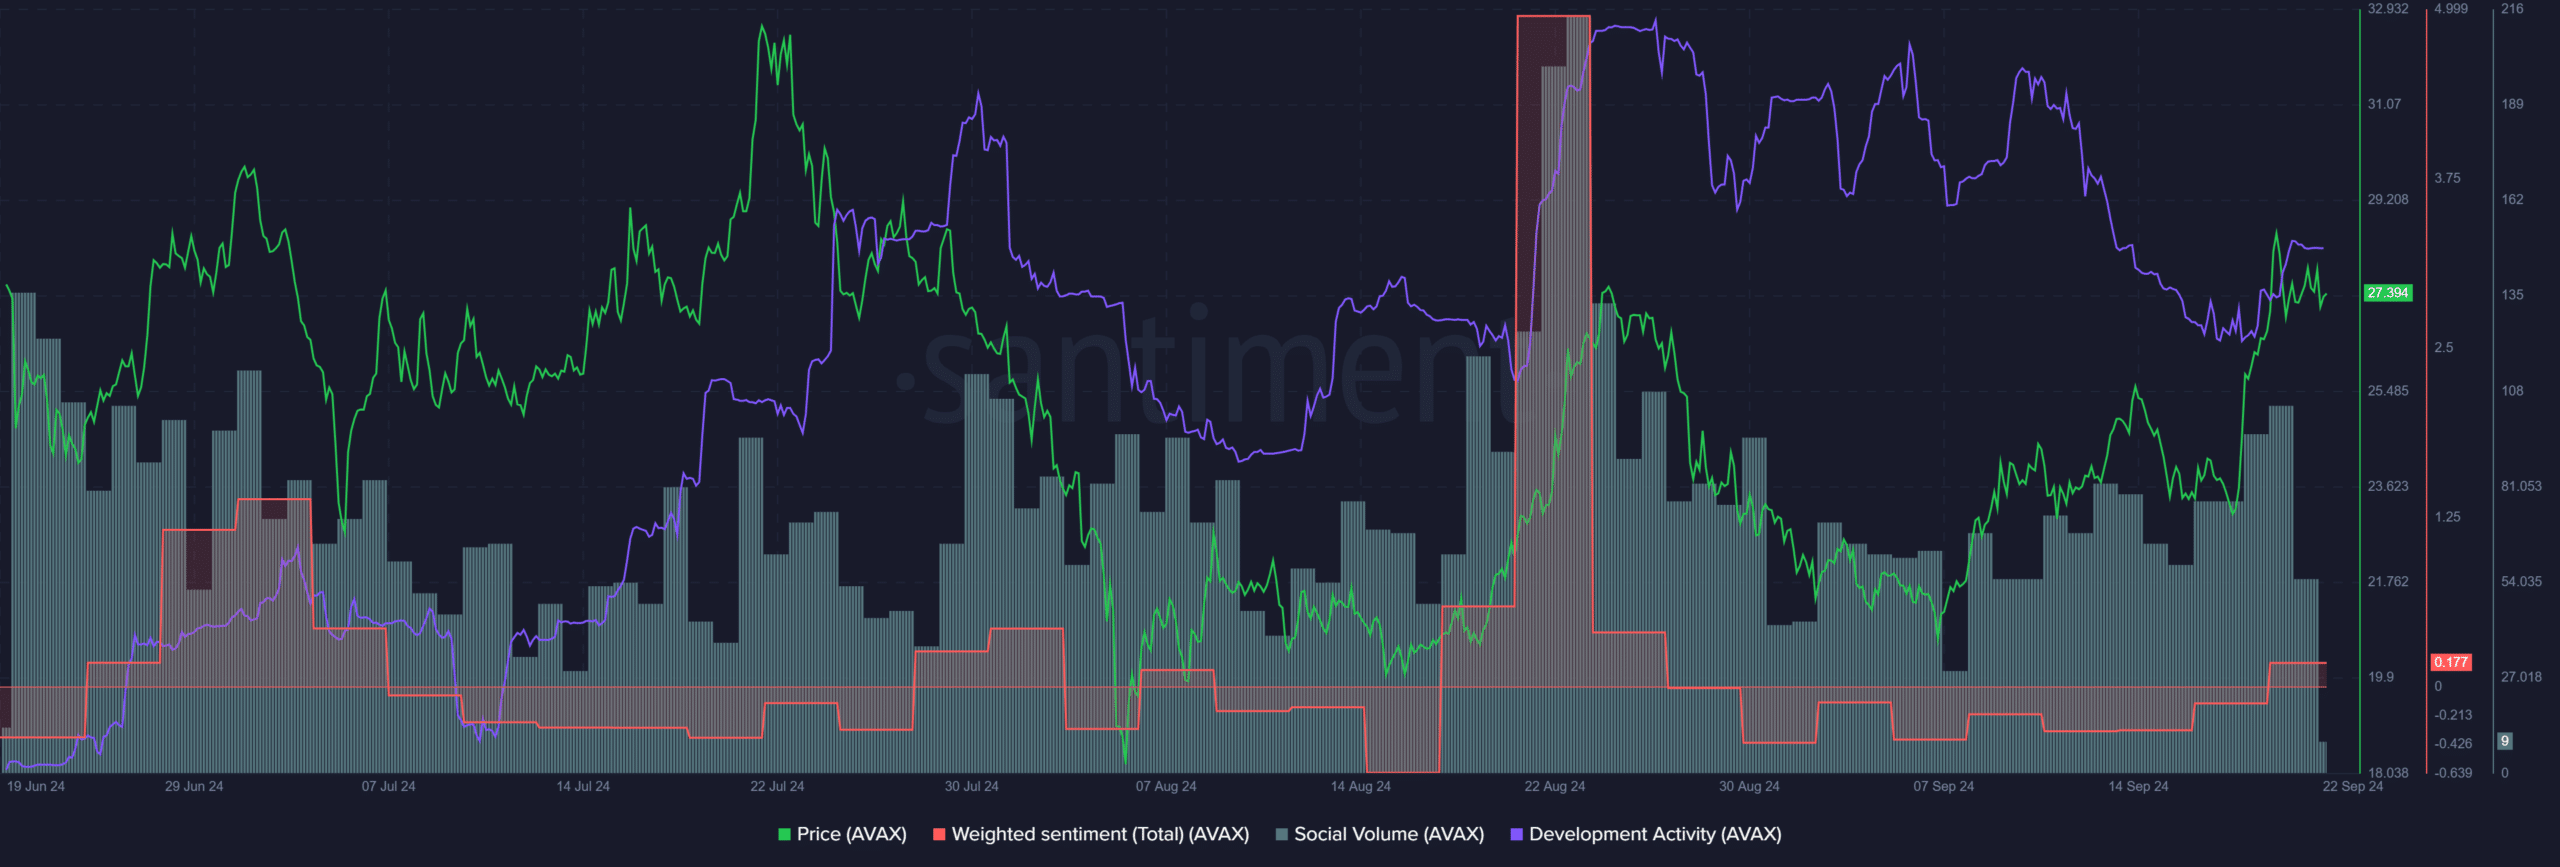
Source: Santiment
The social media engagement has been negative for a good portion of the past month but has begun to shift positively. The social volume also began to trend higher in September.
Is your portfolio green? Check the Avalanche Profit Calculator
Another encouraging sight was the steady development activity since July. It took a step downward since the second week of September but is likely to inspire long-term investors to continue holding AVAX.
Disclaimer: The information presented does not constitute financial, investment, trading, or other types of advice and is solely the writer’s opinion


