AVAX: Here’s where all the buying opportunities will be in the near term

Disclaimer: The findings of the following analysis are the sole opinions of the writer and should not be considered investment advice
The dominance of Tether, measured by the USDT Dominance metric, stood at 4.66% at press time. It has been rising over the past few months too. In fact, this has gone hand in hand with the prices of assets across the crypto-market slumping, evidence of capital flow into stablecoins and away from risk-on assets.
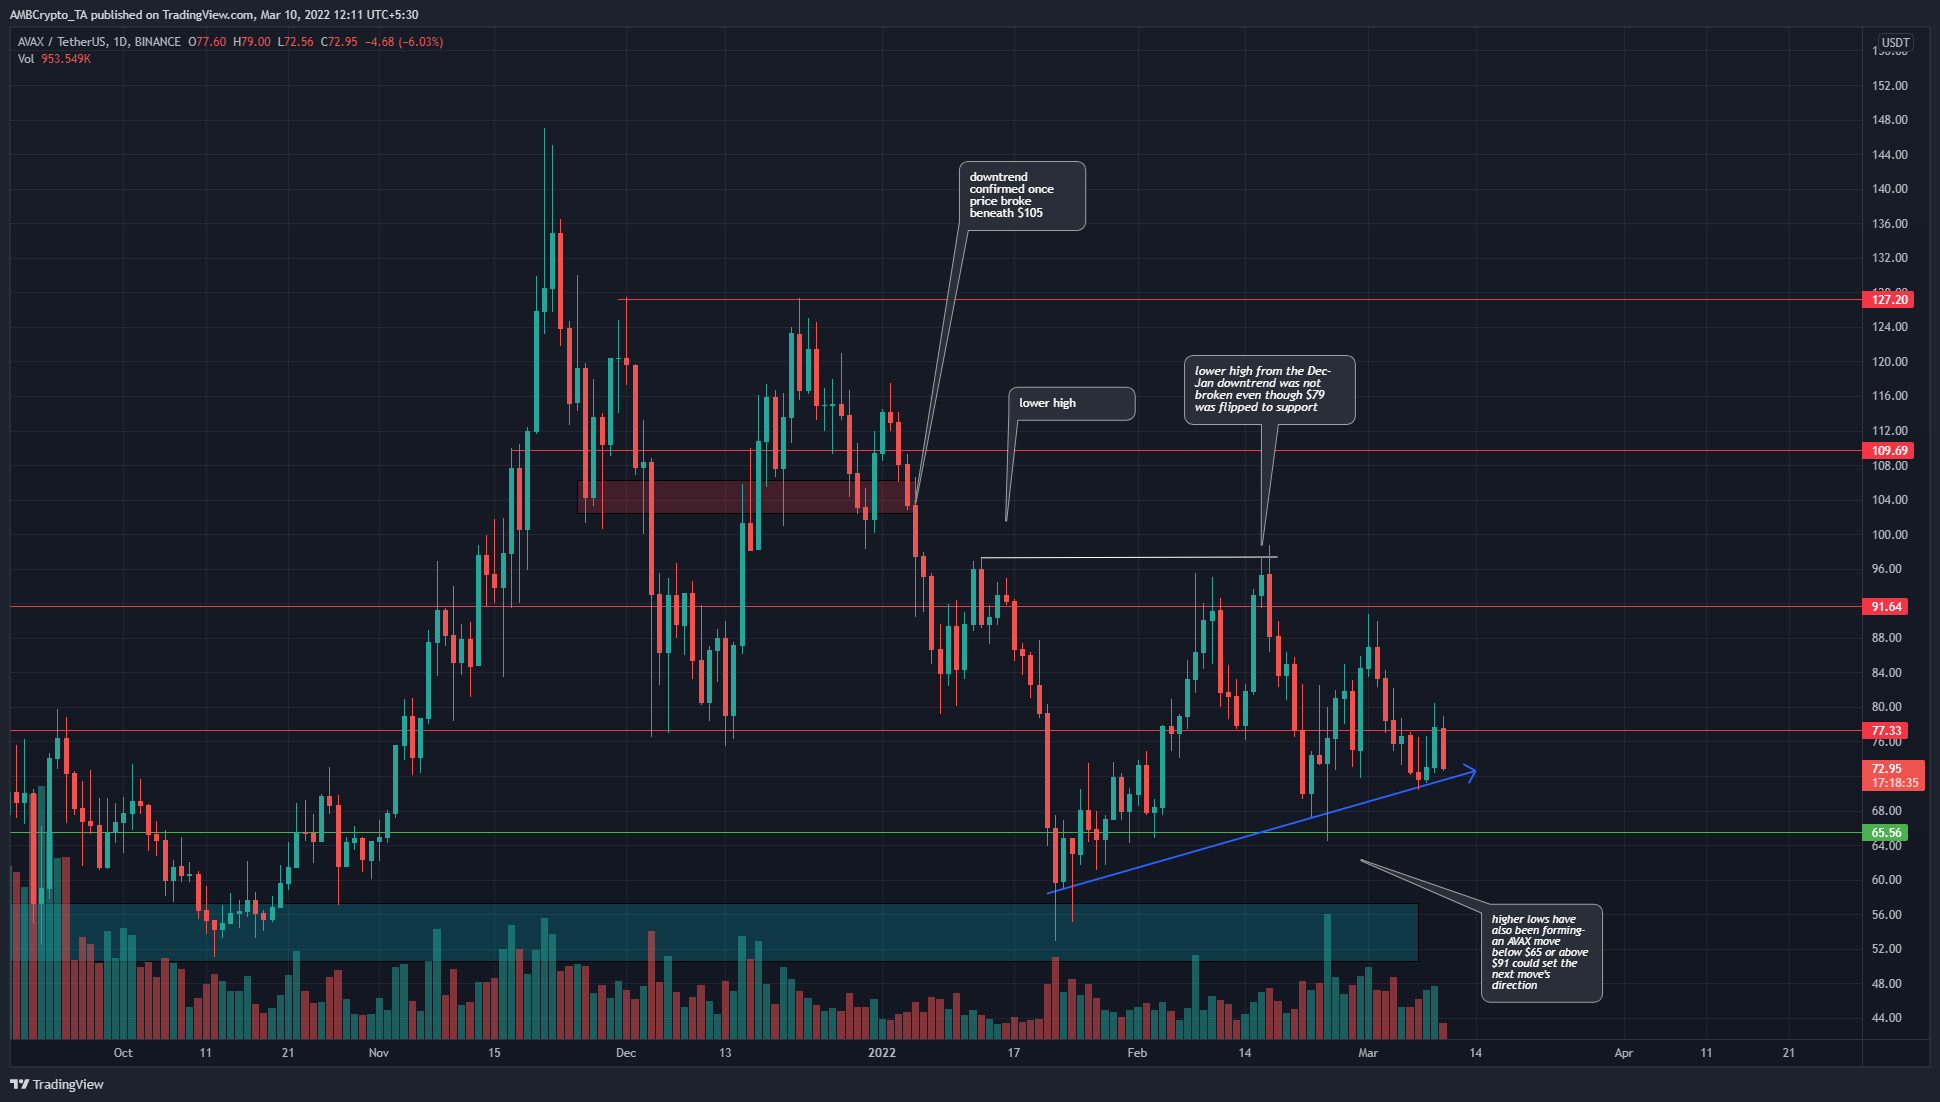
Avalanche has been unable to breach the $100-mark in 2022, facing selling pressure at $96. It is already 50% off from its ATH and could be driven lower on the longer timeframes.
AVAX- 1 day chart
In January and mid-February, the price tried to push towards $100. However, it was stopped at $97.35 and $98.7. Over the same period of time, AVAX formed successive higher lows (indicated by the blue arrow).
The charts showed that the $88-area remained a place to sell AVAX for market participants with a higher timeframe outlook. The $65-support level could be a relatively safe buying opportunity, but a session close beneath $64.45 would invalidate the opportunity.
Further south, the $52-area (cyan box) could also see demand for AVAX arrive across the market.
Rationale
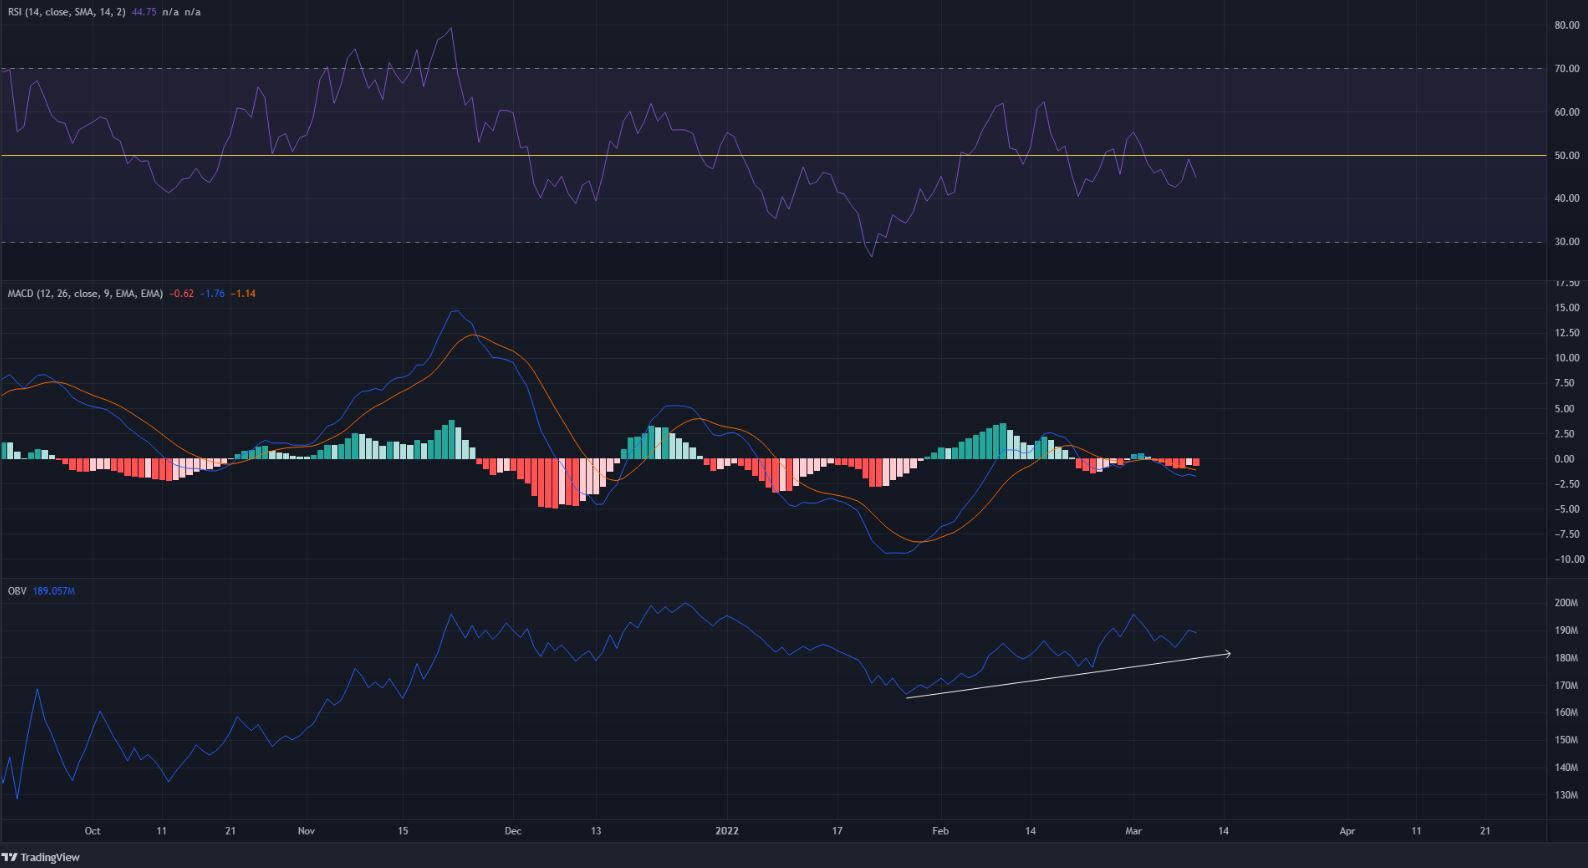
The RSI hovered just under neutral 50 and stood at 44.5, at press time. Just like the price formed higher lows over the past month and a half, the RSI did too. The MACD, however, dropped below the zero line as it formed a bearish crossover and dived lower.
Overall, the momentum was bearish, but the higher lows gave some hope that AVAX could be turning things around. The OBV also climbed higher over the last few months after it formed consistent higher lows despite some pullbacks. Hence, there seemed to be evidence of steady buying despite volatile price action.
Conclusion
The OBV suggested that buying volume has been steady for many months now, even though deep pullbacks were seen in the interim. This demand alone might not rule out another move towards $50 on the charts for Avalanche.
Bitcoin was not bullish on the higher timeframes, so AVAX investors must be prepared to handle risk. $65 and $52 could offer buying opportunities in the weeks to come, while the $88-$95 area would likely be defended by the bears.


