
- Avalanche prices are likely to climb higher in the coming weeks.
- The higher timeframe price chart and the liquidity pockets underlined the potential areas for a trend reversal.
Avalanche [AVAX] was beginning to reverse the losses it endured in May and June. The move past $30 just over a week ago was a sign of bullish intent, and it was likely that more gains were ahead.
However, the higher timeframe trend might not be in favor of long-term investors right now. The Fibonacci levels gave clues about where the price could move to next, and what might follow.
AVAX bulls need to be ready to take profits
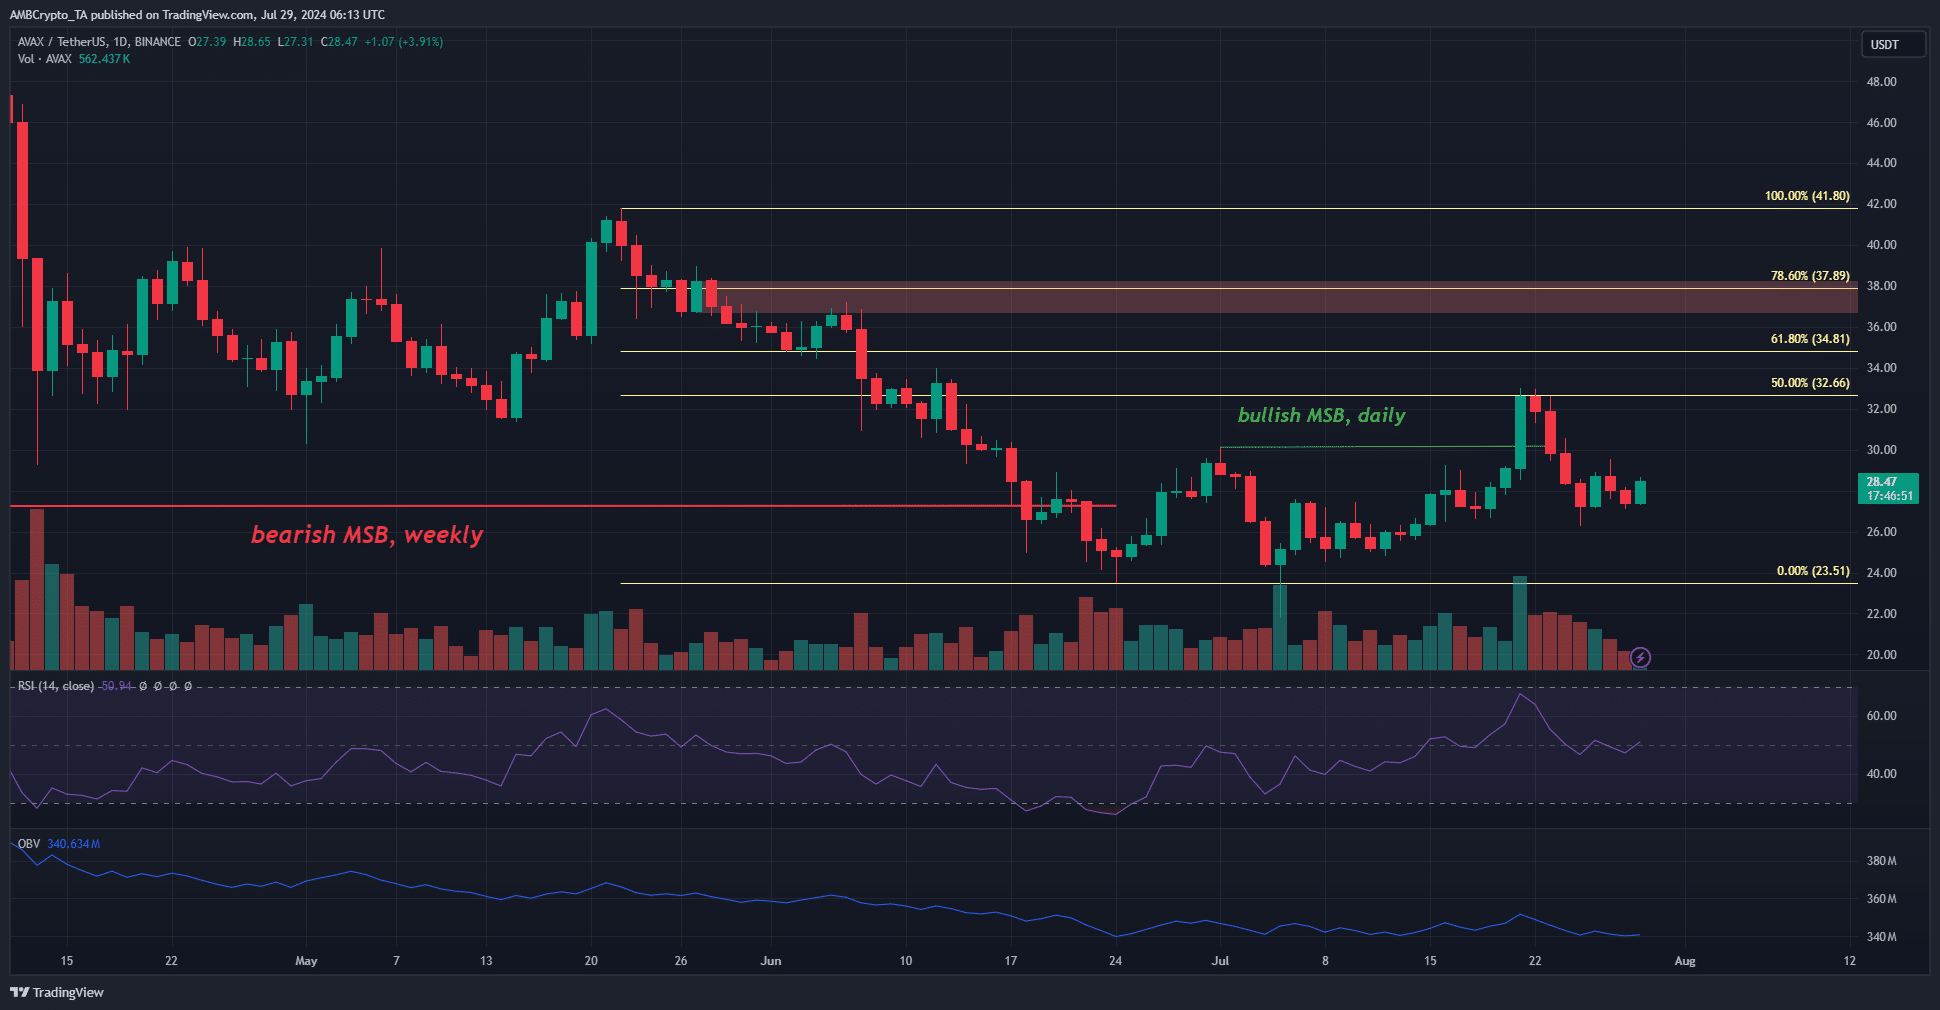
Source: AVAX/USDT on TradingView
At press time, the market structure was bullish on the daily, but bearish on the weekly. This means that we can expect a move toward $40 before a bearish reversal.
Using the May and June price drop, a set of Fibonacci retracement levels was plotted. The 50% level at $32.66 has already served as resistance.
The RSI on the daily was at 51, showing minuscule upward momentum after the past week’s retracement. The OBV was also relatively flat in June and suggested the Avalanche bulls do not have the strength for a large rally yet.
The magnetic zones and hints of the reversal’s location
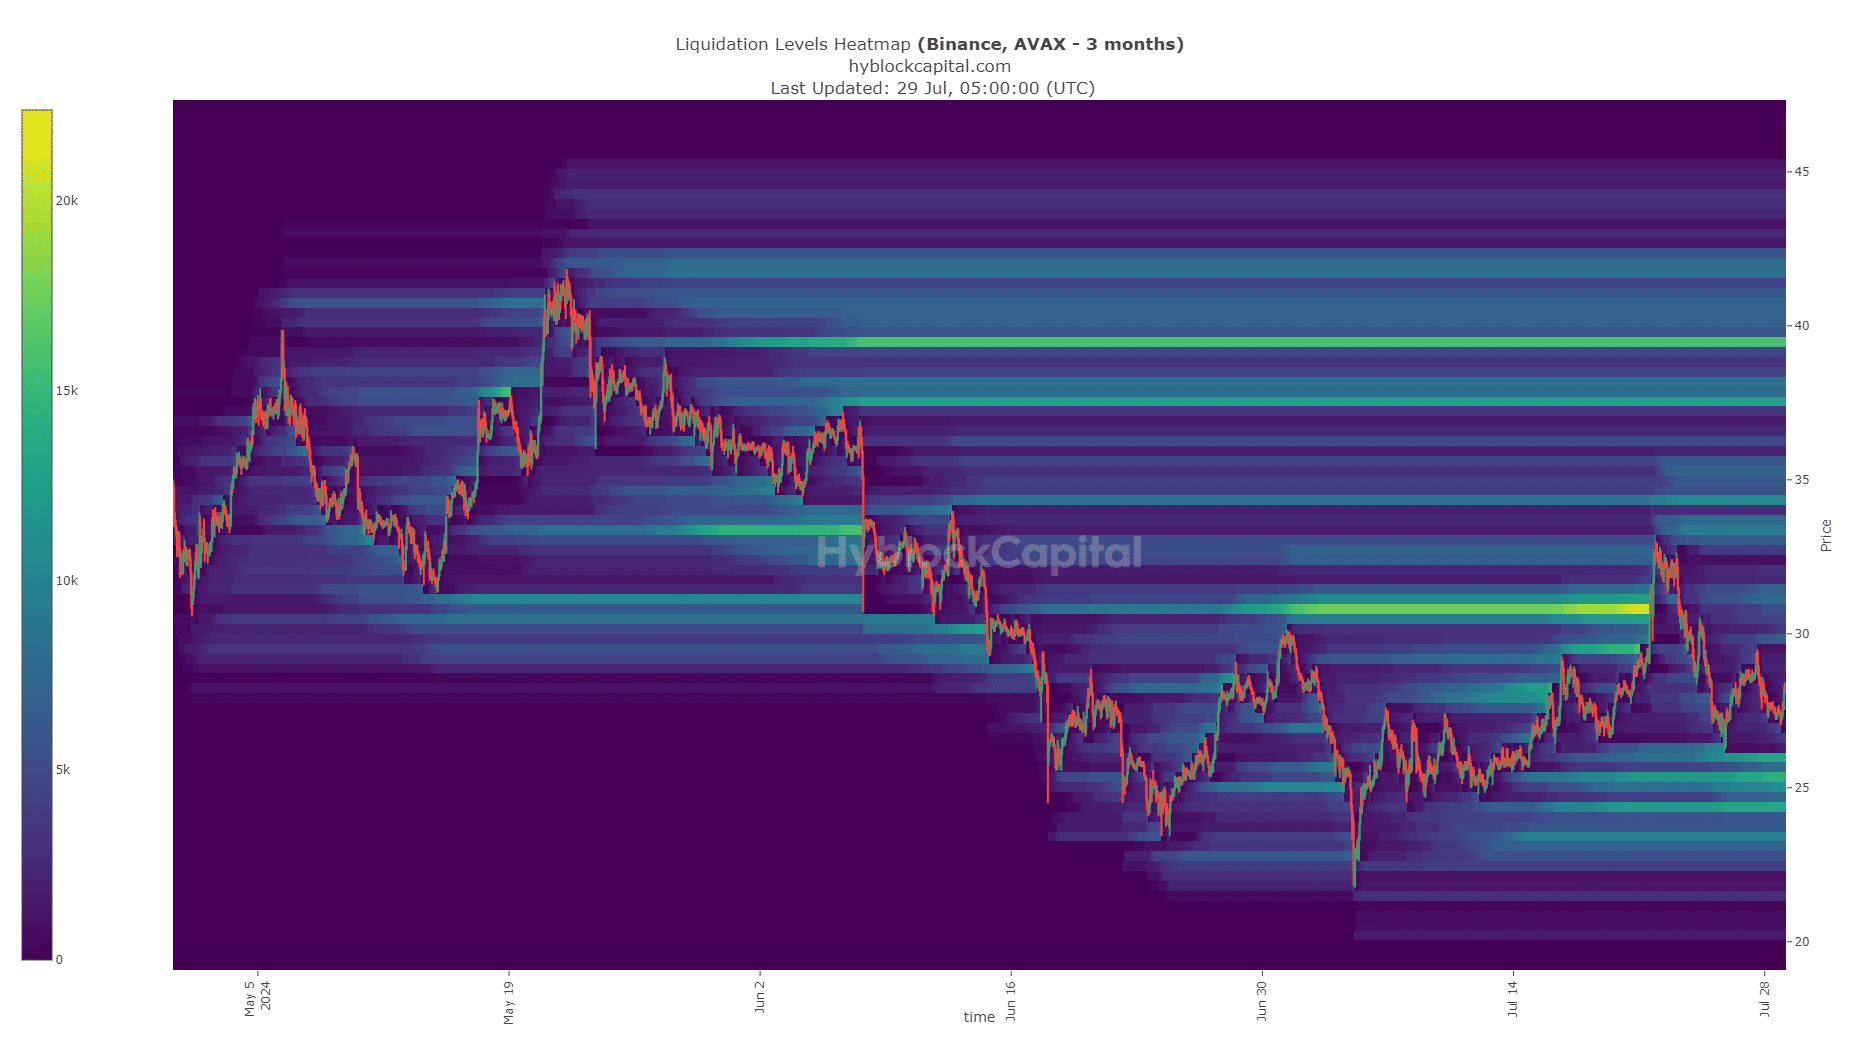
Source: Hyblock
Earlier this month, the liquidity pool at $30.8 pulled prices toward it. AVAX surged to $33 before falling lower. Further north, the $34.3, $37.5, and $39.5 are the targets.
Is your portfolio green? Check the Avalanche Profit Calculator
Prices could form a range above $30 and threaten to fall lower, building up the liquidity in these areas.
They lined up pretty well with the Fibonacci retracement levels outlined earlier. Hence, until the $38 level is breached, swing traders can expect the weekly timeframe’s market structure to be valid.
Disclaimer: The information presented does not constitute financial, investment, trading, or other types of advice and is solely the writer’s opinion.