Axie Infinity has support at $10.15 but bears could have upper hand unless…

Disclaimer: The information presented does not constitute financial, investment, trading, or other types of advice and is solely the writer’s opinion.
- The inefficiency from $9.7 was not filled completely.
- A move above $12.3 can herald the next leg upward for AXS.
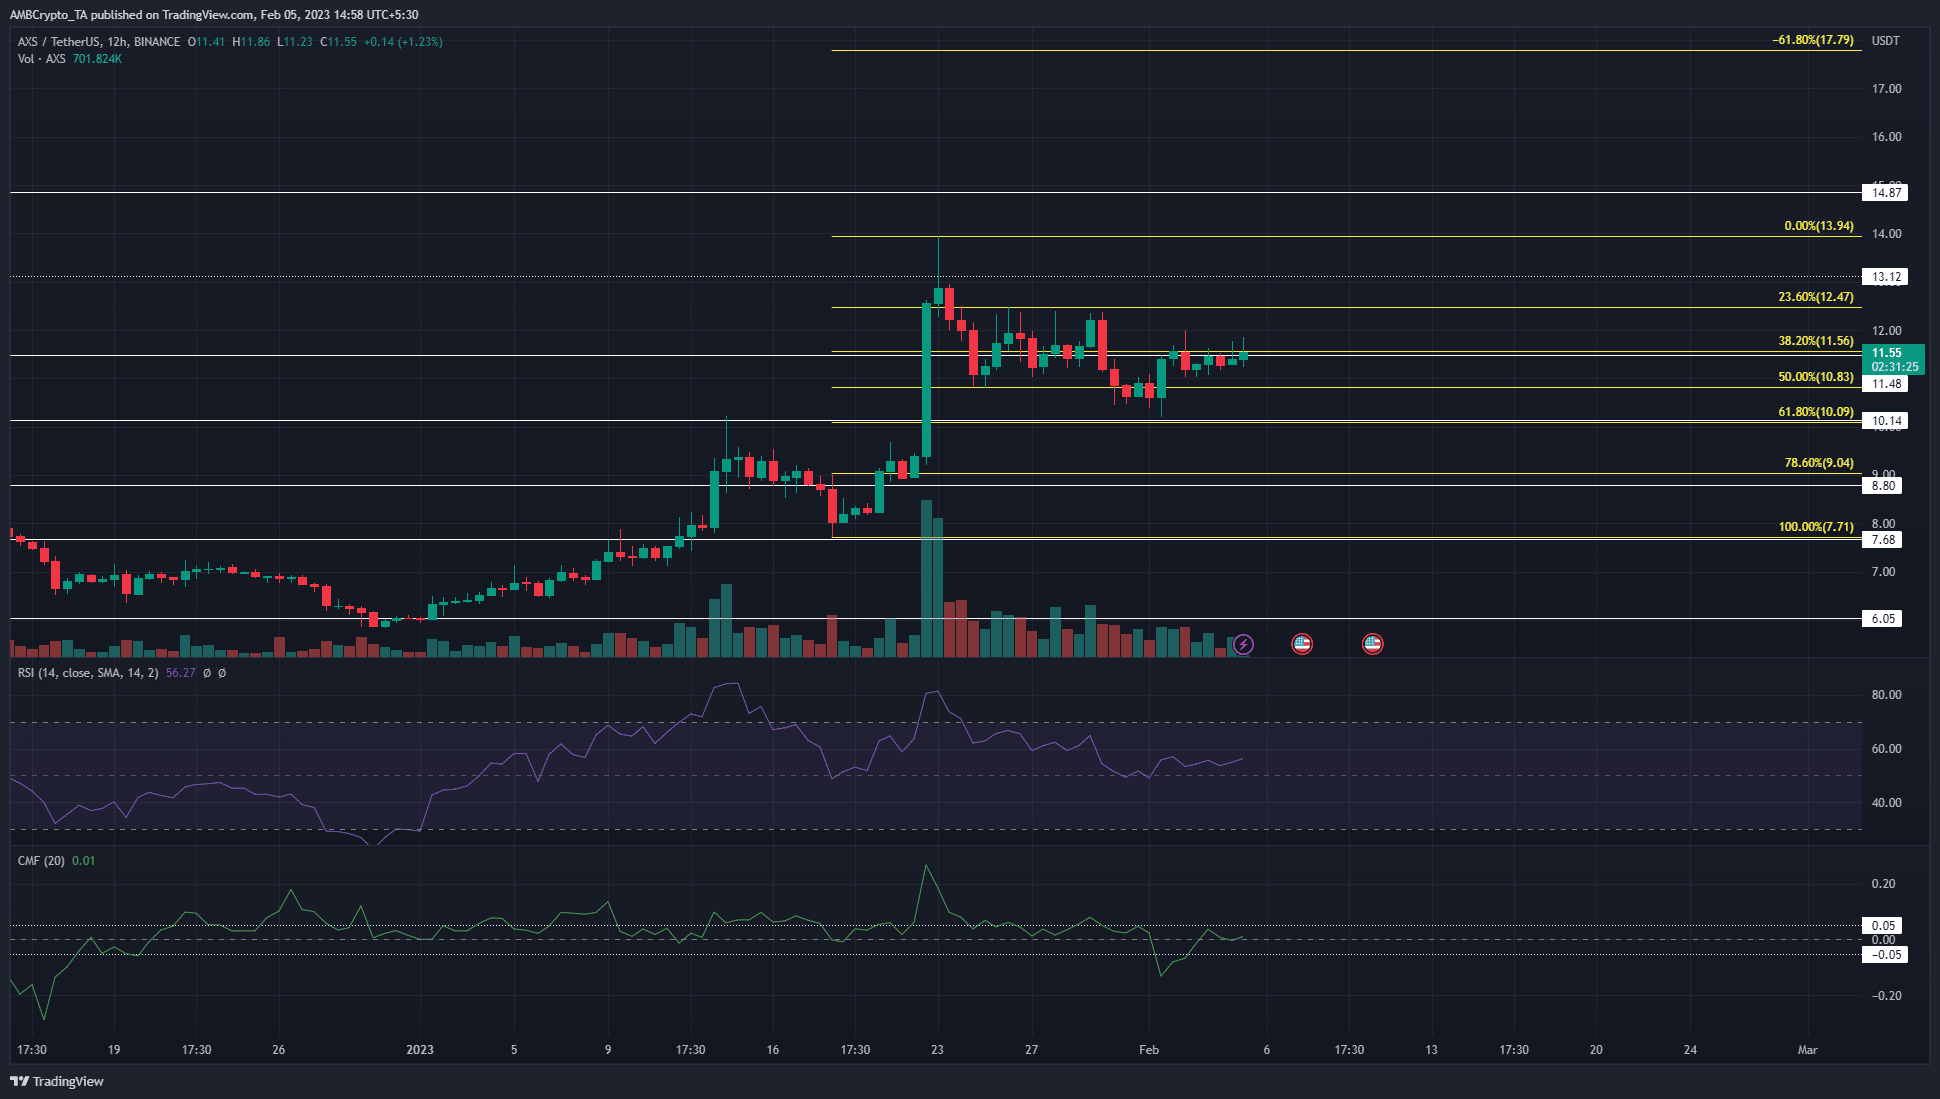
Axie Infinity has receded from $14 in the past two weeks. The series of lower highs and lower lows in this time period denoted a bearish market structure. Therefore buyers can wait for a breakout past $12.3 before looking to buy.
Read Axie Infinity’s Price Prediction 2023-24
Axie Infinity has an imbalance on the price charts that extended from $9.7 to $12.2, but a good portion of this area has been filled. Aggressive traders can wait for a move toward $12-$12.3 before looking to sell.
Overall, risk-averse traders can wait for Monday’s open and close before entering trades.
The 61.8% level saw a bullish reaction but a bearish order block impeded the way
Based on the move upward from $7.71 to $13.94, a set of Fibonacci retracement levels (yellow) was drawn. It showed the 61.8% and 78.6% retracement levels to lie at $10.09 and $9.04.
The $10.09 level was approached and buyers forced AXS prices northward once more.
Is your portfolio green? Check the Axie Infinity Profit Calculator
On January 29, Axie Infinity moved up from $11.69 to $12.3. This was followed by a sharp drop to $10.6, which collected the liquidity beneath the $11 mark.
Therefore, the $11.7-$12.3 area is said to represent a bearish order block. This area will need to be overcome before buyers can anticipate another move higher.
In the meantime, both the RSI and the CMF showed neutral readings. The RSI stood at 56 to denote some bullish presence and has remained above neutral 50 since early January.
This underlined the idea that the longer-term bias remains bullish, but traders can be wary of a shift in sentiment to bearish due to the market structure. Caution was key, and the $12 level’s retest could be illuminating.
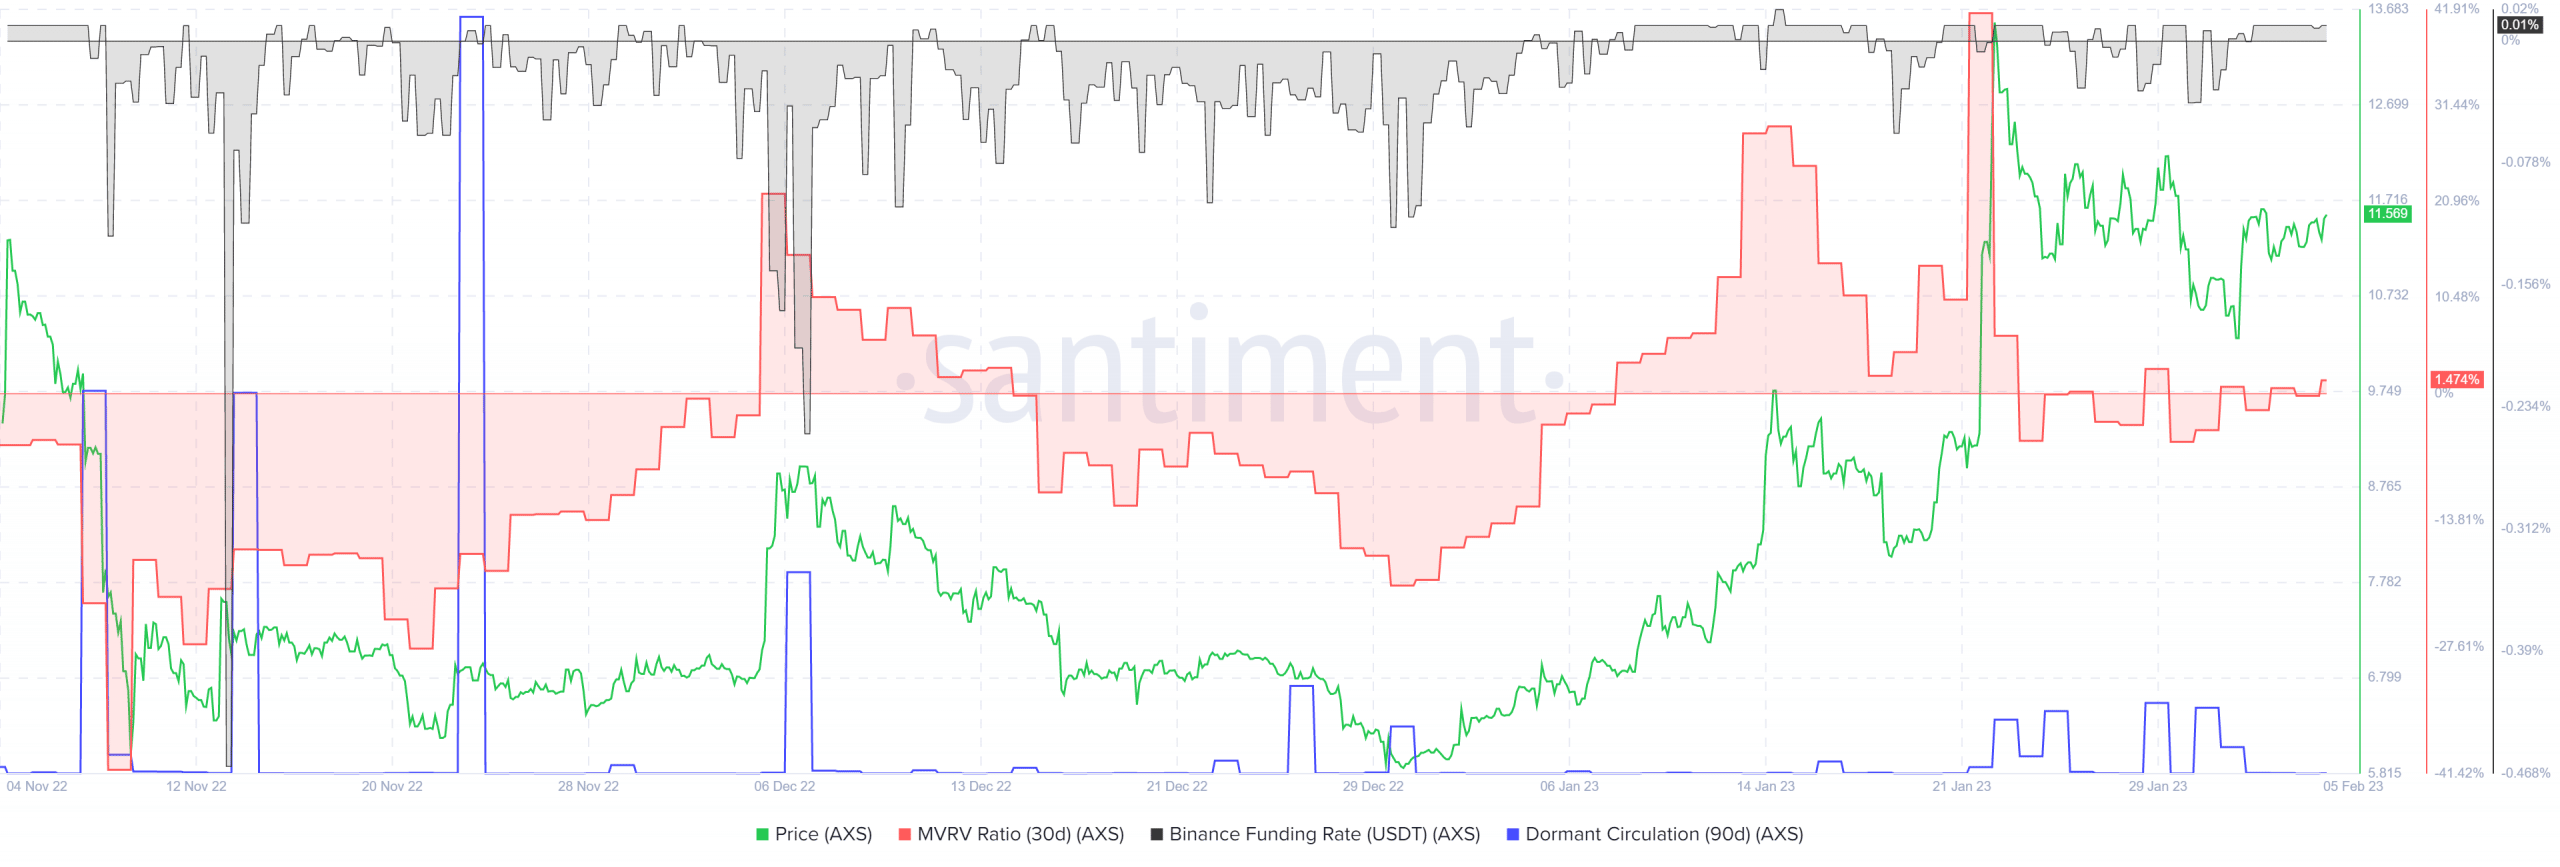
The flat 90-day dormant circulation meant a wave of selling was not yet upon us

Source: Santiment
The positive funding rate meant participants are bullish. The MVRV ratio (30-day) was near the zero mark to show that near-term holders were not at a significant profit yet. The previous peak on January 22 was followed by a large wave of selling.
The 90-day dormant circulation did not see a significant spike in recent weeks. The ones on December 6 and January 29 were followed by some selling pressure, but this need not always be the case.


