


Disclaimer: The information presented does not constitute financial, investment, trading, or other types of advice and is solely the writer’s opinion
- Axie Infinity labored under stern selling pressure
- A move below $6.6 and $6 can provide bears with opportunities
Axie Infinity fell below the $7.7 mark yet again in mid-December, after the bulls fought throughout November to climb past this mark. Given the sentiment across the crypto market, a strong uptrend might not be seen for a few more months.
Hence, long-term investors might wonder whether to DCA or wait for another leg downward, given AXS’ trend since September.
How many AXSs can you get for $1?
The market structure on the 12-hour timeframe was bearish. To change this, AXS must close a trading session above $8.23. Even so, $8.8 would loom large above the buyers. Do they have the strength to force prices above $8.8 in the weeks to come?
The attempt to reclaim $8.8 exhausted the bulls and sellers have dominated since
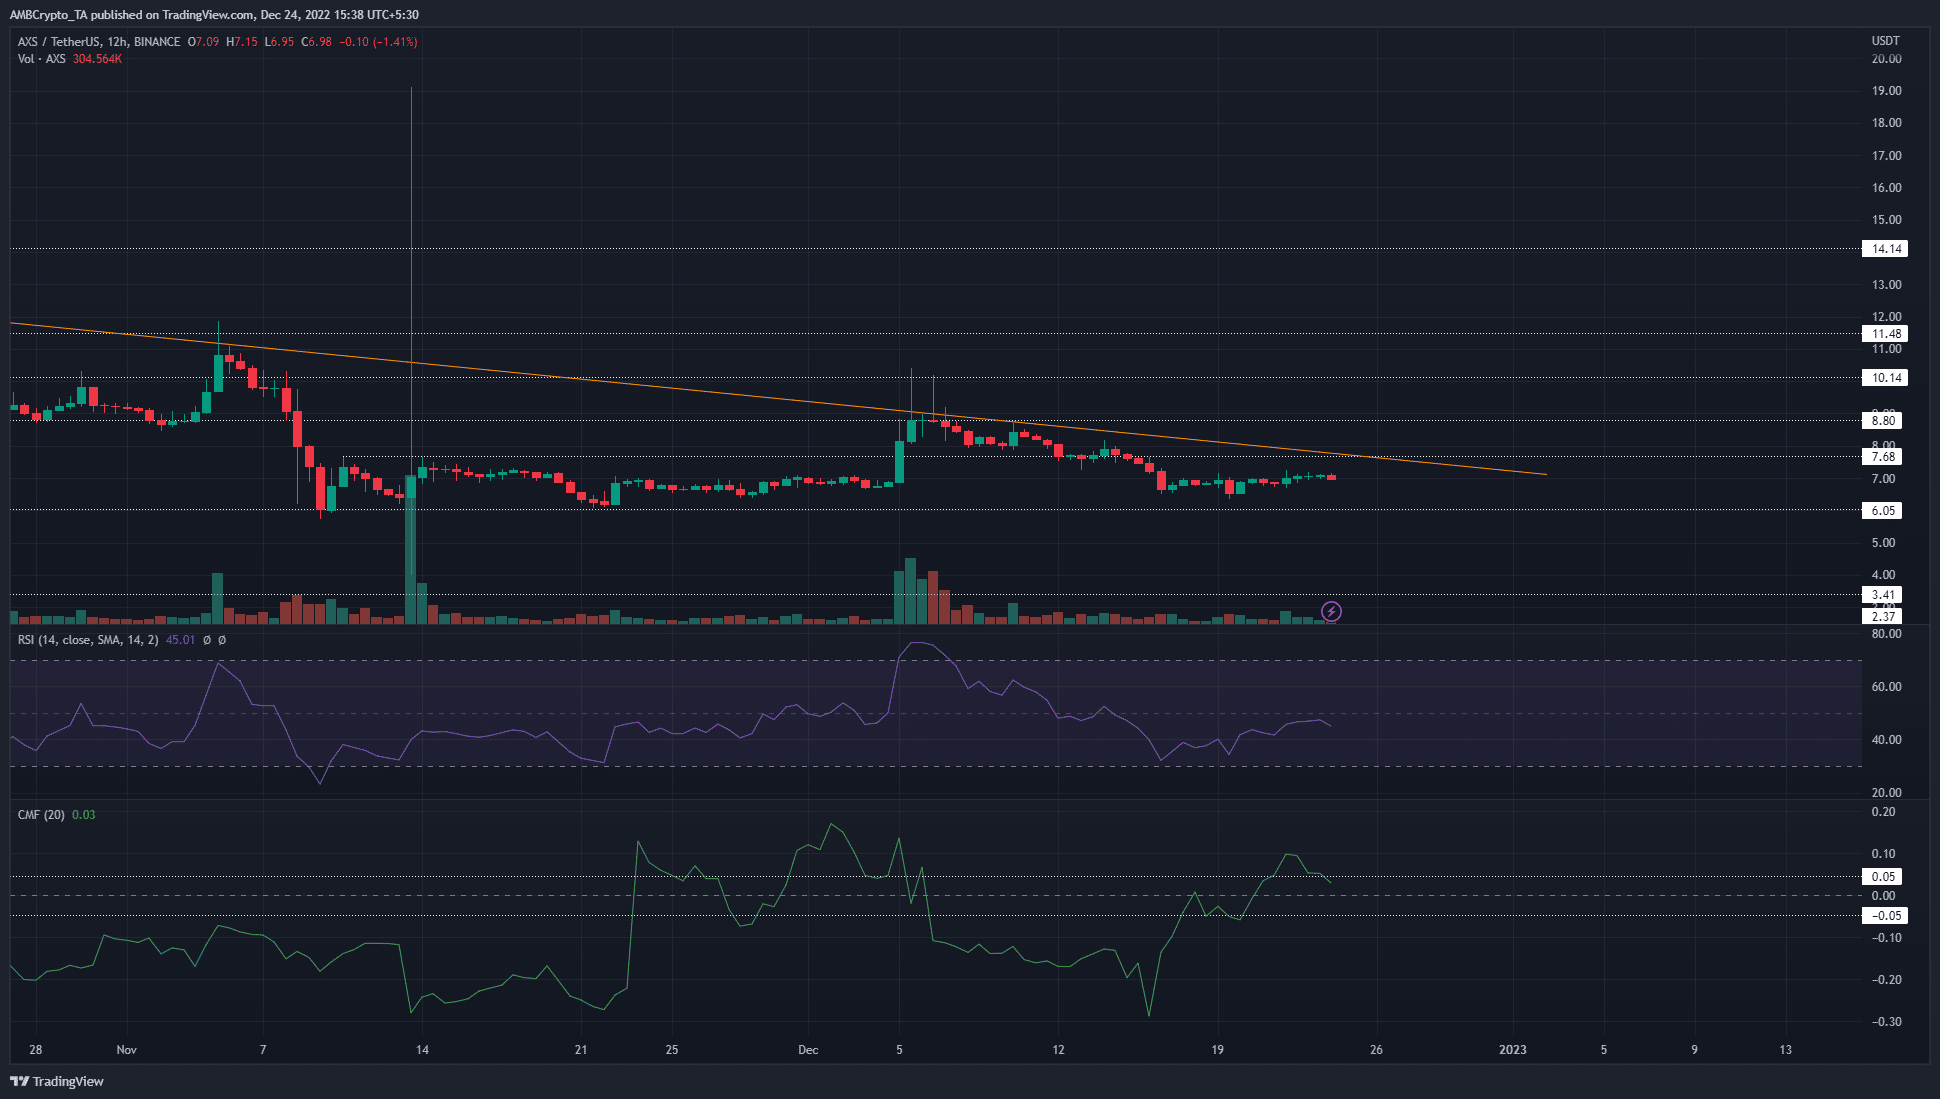
The orange trendline connected the series of lower highs that AXS has made on the price charts since 3 September. Even before that, the trend had been bearish, and $19 was flipped to resistance in August.
On 5 December, Axie Infinity tokens saw a large surge from $6.87 to $10.4. This indicated a shift in sentiment to a bullish bias might have occurred. However, that day’s trading closed at $8.79, just beneath the significant resistance at $8.8. Subsequent attempts to flip $8.8 to support were met with failure.
The Relative Strength Index (RSI) fell beneath the neutral 50 mark on 12 December in the 12-hour timeframe to indicate momentum favored the bears. At press time, it stood at 45 to signal weak bearish momentum. The Chaikin Money Flow (CMF) climbed in the past ten days to indicate strong capital flow into the market but AXS has not reacted positively yet.
A 403.58x hike on the cards IF AXS hits Bitcoin’s market cap?
Higher timeframe support lay at $6, and $6.6 was important on lower timeframes. A move beneath $6.6 and a subsequent retest can be used to enter short positions targeting $6. Below $6, $4. and $3.42 could serve as support levels.
Open Interest declines alongside the price to signal bearish sentiment
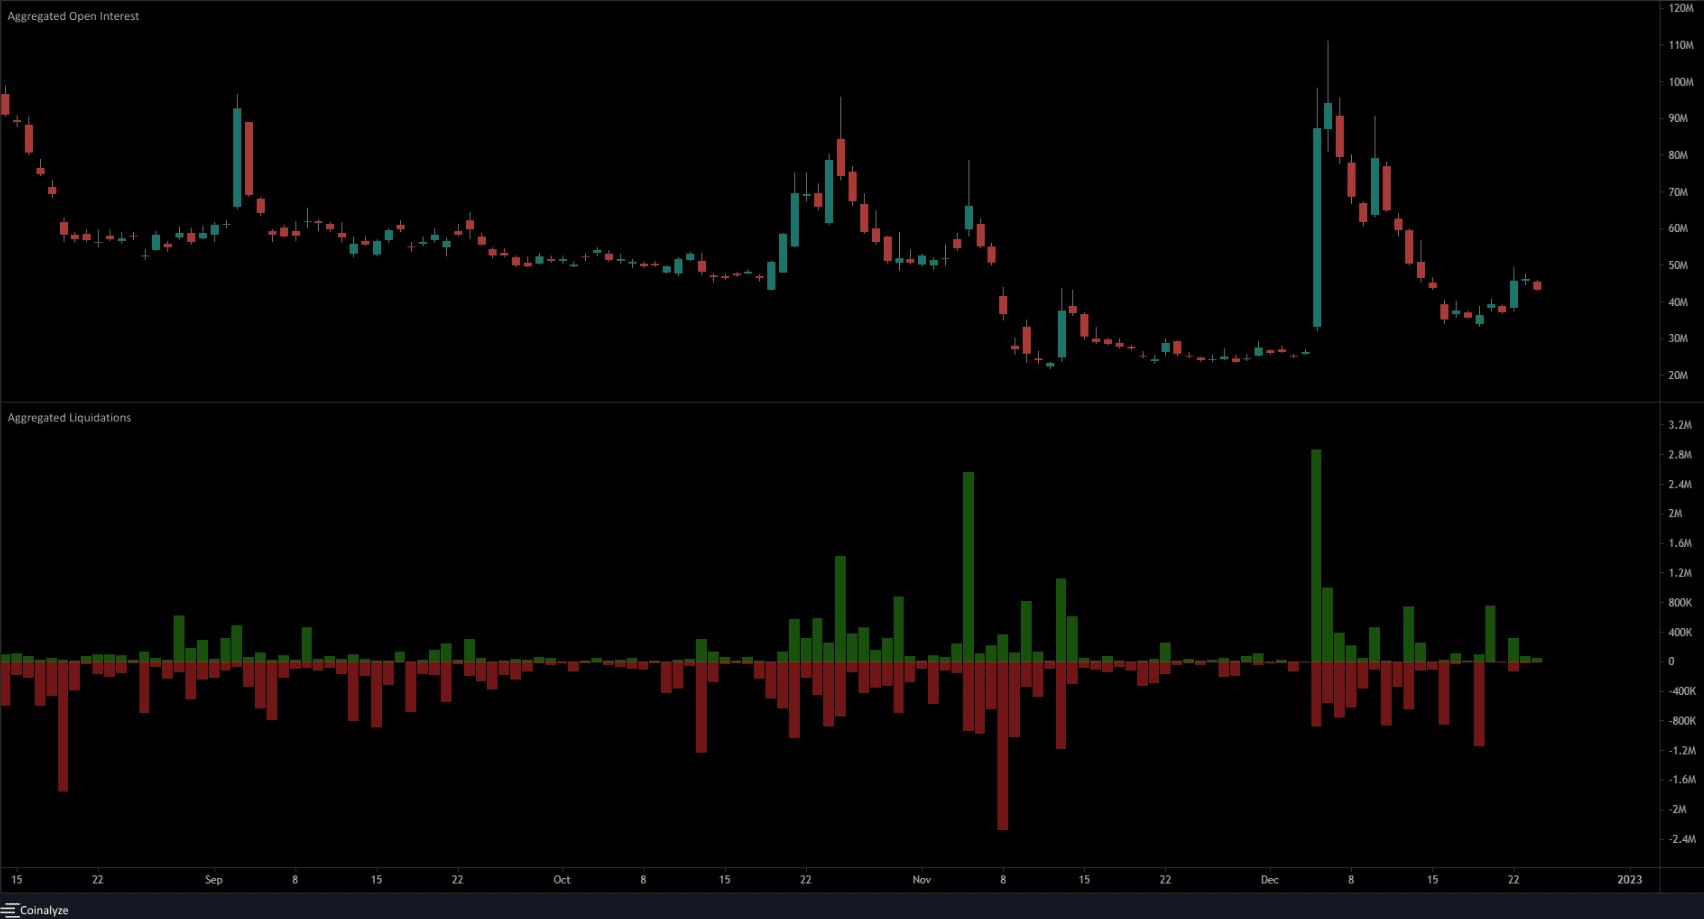
In early December, Axie Infinity encountered a wave of euphoria and surged to $10.4. Aggregated Open Interest soared and short positions were liquidated in large numbers due to the violent movement.
Since then, the price continued to follow the higher timeframe downtrend. On lower timeframes such as the four-hour, the momentum was bearish as well. The drop in Open Interest coupled with declining prices meant long positions were discouraged and sentiment remained bearish in futures markets.