AXS in a low timeframe consolidation could mean this for traders

Disclaimer: The findings of the following analysis are the sole opinions of the writer and should not be considered investment advice
Axie Infinity has followed Bitcoin’s price movement pretty close on the charts, in terms of the timing and the direction. It has been more volatile than Bitcoin, which is usual for altcoins. It appears that the next trend of AXS could be determined by Bitcoin. $42k for BTC and $50 for AXS are levels the bulls would like to see flipped back to support. There was some evidence to suggest AXS is undervalued based on the NVT ratio, but could this effect a reversal of the downtrend?
AXS- 1 Hour Chart
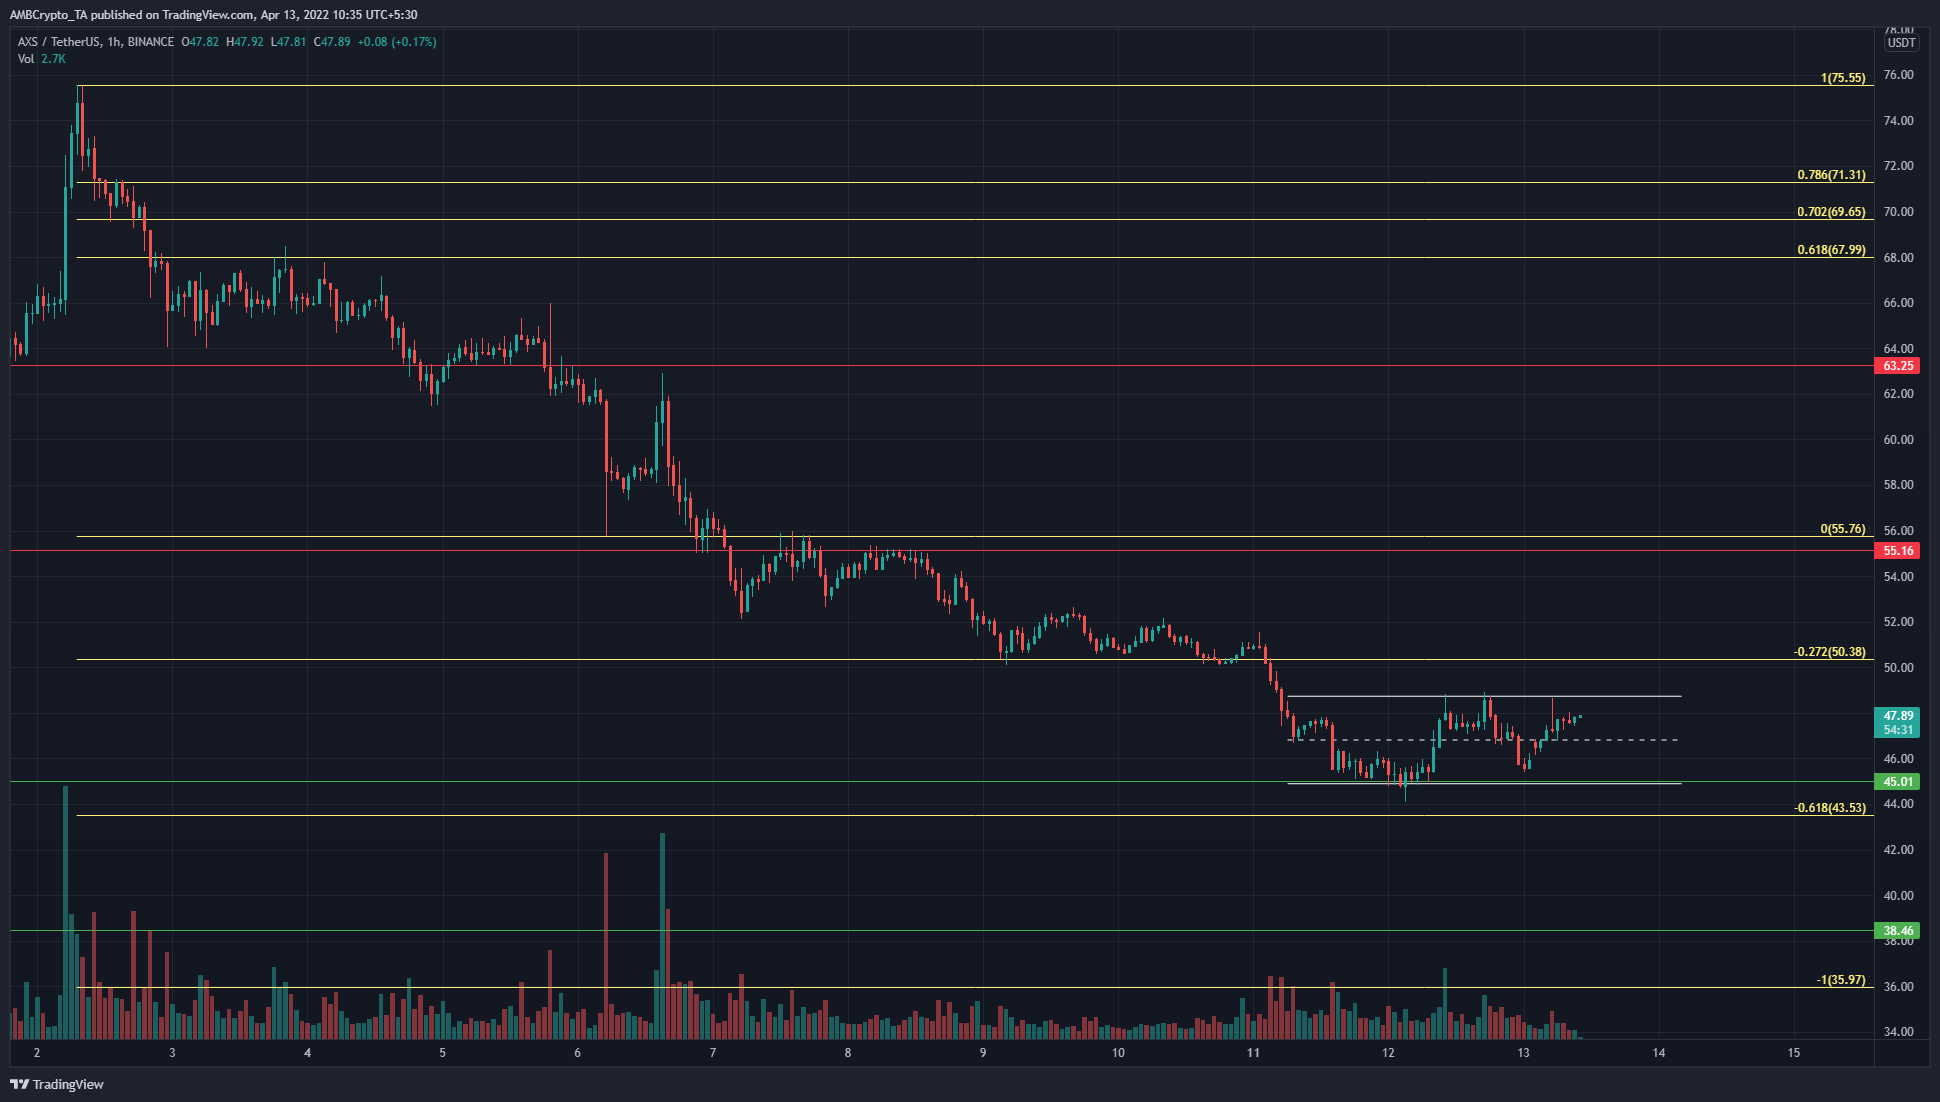
A set of Fibonacci extension levels (yellow) were plotted based on AXS’s move south from the swing high at $75.55 to the swing low at $55.76. In the past week, the price slid beneath this swing low and has also slumped beneath the psychological $50 support level, which was also a 27.2% Fibonacci level.
In the past couple of days, the price has moved sideways within a range. This could be a bottom for AXS. In early March, the price found support at the $45 level and consolidated before a bullish move toward $70.
If sufficient demand can step in, a similar scenario could play out. Zooming out on the charts, there was the possibility that the whole of the past two months has seen AXS range from $45 to $72. Therefore, buying AXS at the range lows could be profitable in the weeks to come.
Rationale
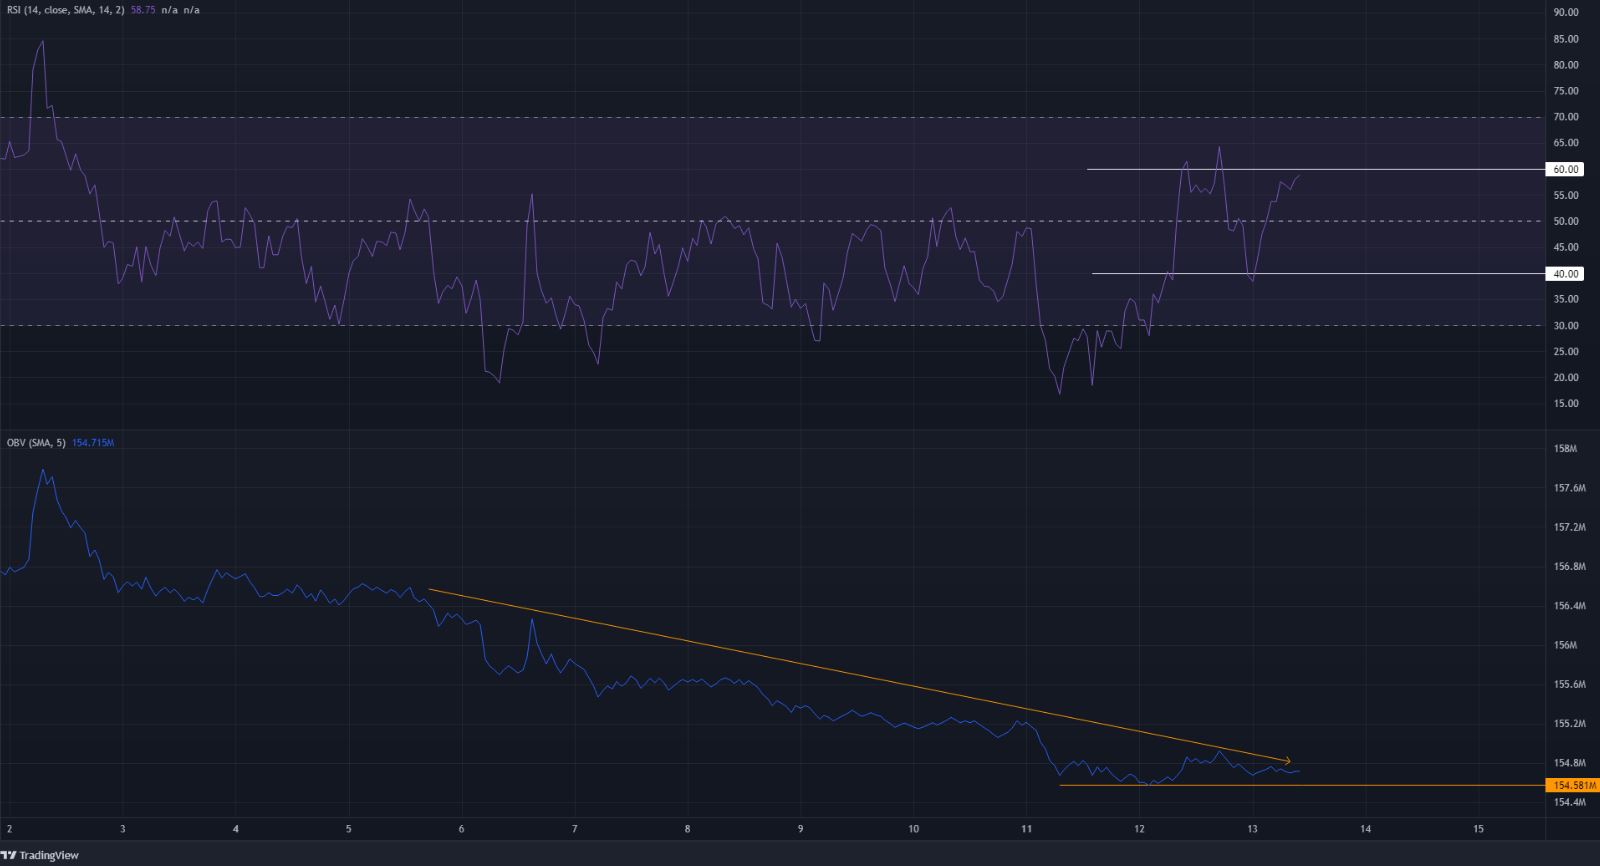
The hourly timeframe was not very encouraging for the bulls. Instead of a rapid recovery, the market participants are witnessing a range being formed. The RSI has oscillated between the 40 and 60 values on the previous day, to indicate the lack of strong momentum in one direction.
The OBV has been in a downtrend for the past ten days but has moved sideways in the past couple of days. This movement mirrored the movement of the price. Buyers would need to be wary of the OBV dropping below the horizontal (orange), as it could indicate strengthening selling volume.
Conclusion
A buy of AXS at the two-month range lows would need to be managed carefully. Shorter timeframe traders can look to book profits at $50 and $55, while longer-term investors can look to DCA from $43-$50.


