BCH’s closing price of 2022 had this BTC connection, will 2023 be any different?

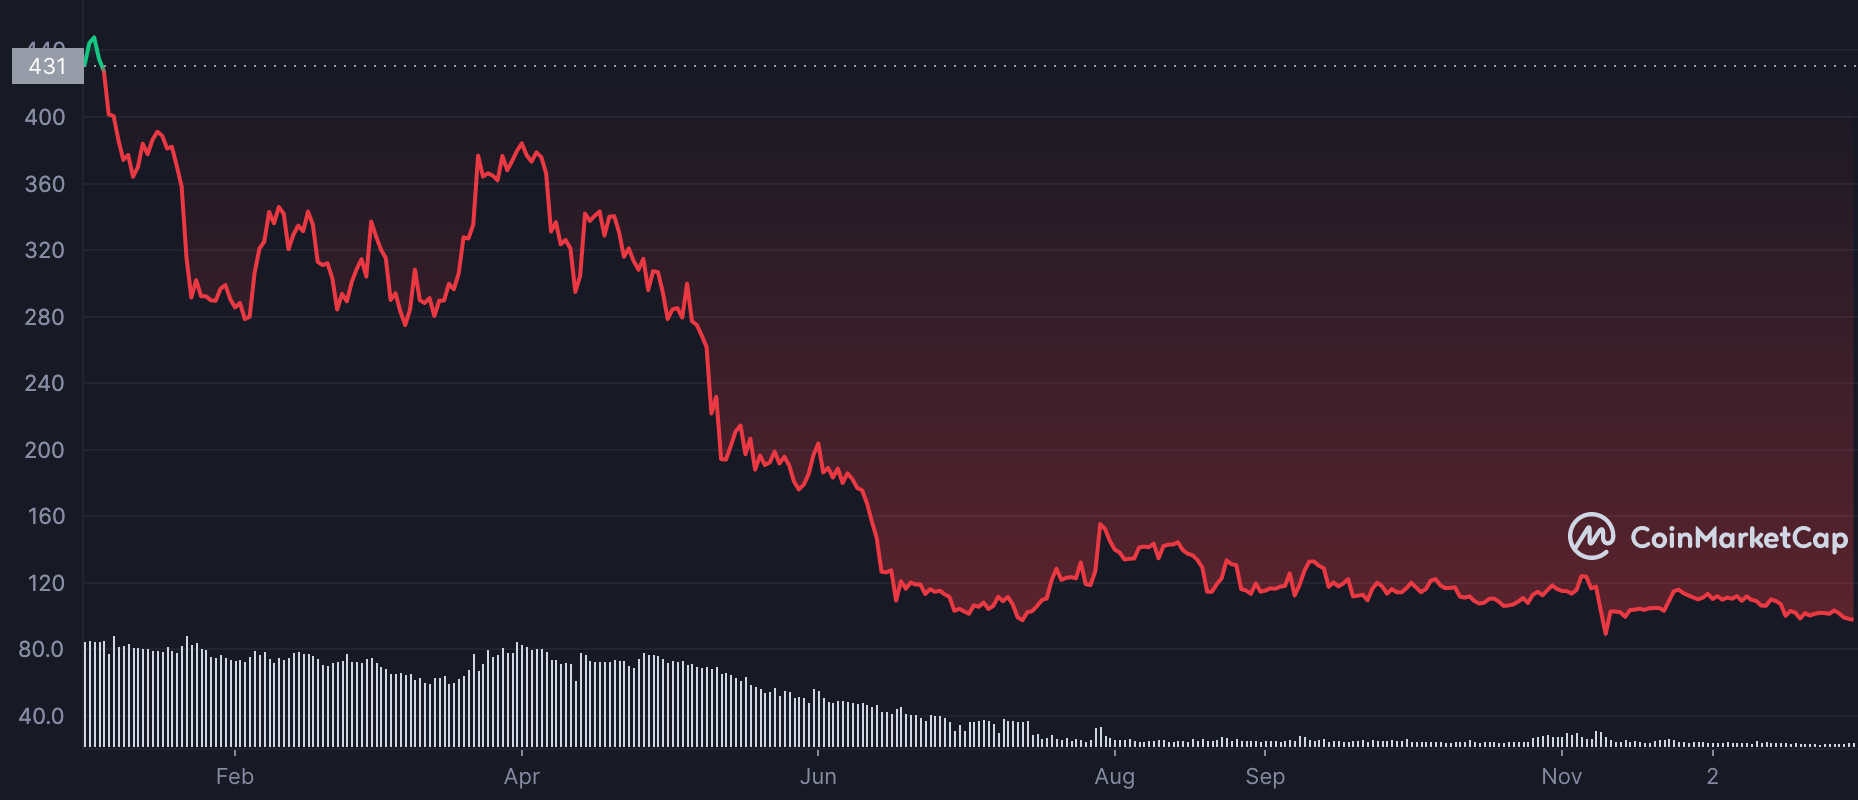
- BCH ended 2022 at a 2-year low
- However, BCH witnessed a growth in coin distribution
Bitcoin Cash [BCH], was trading at $97.74 as of 31 December and closed 2022 at a two-year trading low, data from CoinMarketCap revealed. Also impacted by the severe decline in the cryptocurrency market during the year, BCH’s value dropped by 77%.
Read Bitcoin Cash’s [BCH] price prediction 2023-2024
Per data from CryptoWatch, BCH shares a statistically significant positive correlation with leading coin, Bitcoin [BTC]. Hence its performance in 2022 mirrored that of the king coin.
Only for the bears…
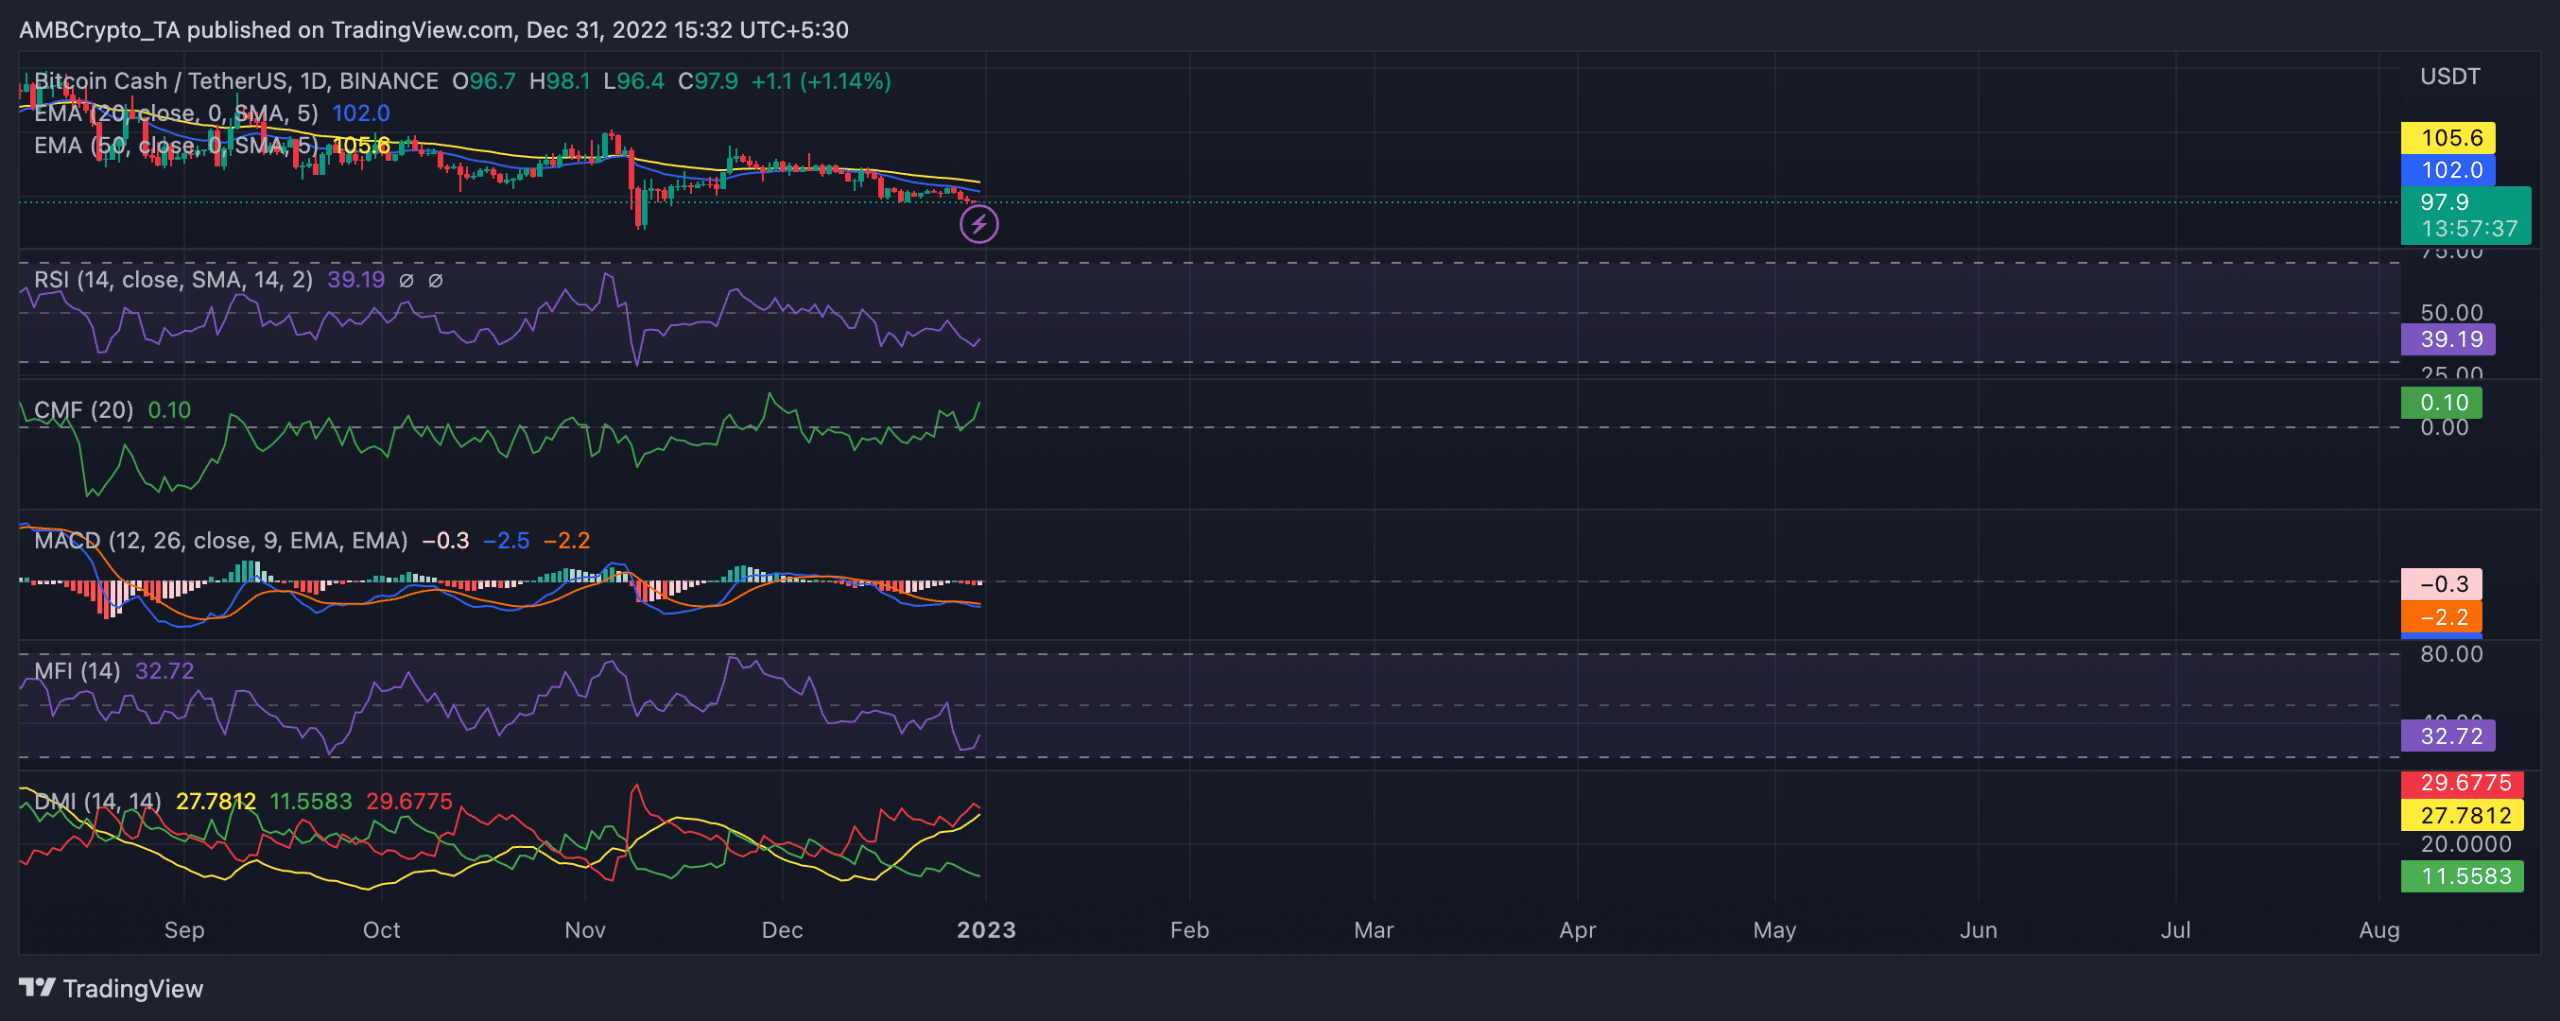
An assessment of BCH’s performance on the daily chart revealed that it closed 2022 being severely oversold. In addition, indications derived from the daily chart showed that BCH had lost market control to the bears since 12 December.
A look at the Moving Average Convergence Divergence (MACD) revealed a downward intersection of the MACD line (blue) with the trend line (orange) since 12 December. Thus, kickstarting a new bear cycle for the altcoin. Since then, its price declined by 8%.
Are your BCH holdings flashing green? Check the Profit Calculator
The spots occupied by BCH’s Directional Movement Index (DMI) and Exponential Moving Average (EMA) confirmed that sellers had control of the market. At press time, the DMI showed the sellers’ strength (red) at 29.67 was solidly above the buyers’ (green) at 11.55.
Additionally, the Average Directional Index (ADX) also indicated that the sellers had a very strong hold on the market. This could make it difficult for buyers to regain control in the short term.
Further, the Exponential Moving Average (EMA) showed that sellers were currently dominating the market. This was because the 20 EMA (blue line) stood below the 50 EMA (yellow line). This suggested that those who were selling their coins had more influence in the market than those who were accumulating them.
A look at key indicators such as the Relative Strength Index (RSI) and Money Flow Index (MFI) further confirmed the oversold nature of BCH. At press time, these indicators were pegged in downtrends at 39.19 and 32.72, respectively.
Too soon for a bullish relief?
An assessment of BHC’s Chaikin Money Flow (CMF) offered a bullish respite. At press time, the dynamic line (green) of the asset’s CMF posted a positive value of 0.09 and was spotted in an uptrend. Thus, creating a bullish divergence.
A CMF buy-signal is seen when an asset’s price action develops a lower low into oversold zones, with the CMF diverging with a higher low and beginning to rise.