BEAM’s price defies market trends with multi-month uptrend, but what should traders do?
Without a clear sign of a short-term pullback, swing traders need to wait and not rush to look for re-entry.



Gaming sector and ecosystem token Beam [BEAM] has rallied by 45.2% in the last 24 hours, with a 1,115% hike in daily trading volume. The $241.6 million market cap asset has been trending higher since July.
While the rest of the crypto sphere panicked and sold after news of the Binance heist broke, BEAM’s price surged across the board.
This relative strength was likely due to its existing bullish momentum. It was reported that the Beam Foundation had burned all the BEAM tokens in the possession of the Binance hacker.
984.249 million tokens worth around $3.37 million were burned using the Gnosis Safe Burn Signature, which also helped explain the short-term bullish outlook.
BEAM continues its multi-month uptrend
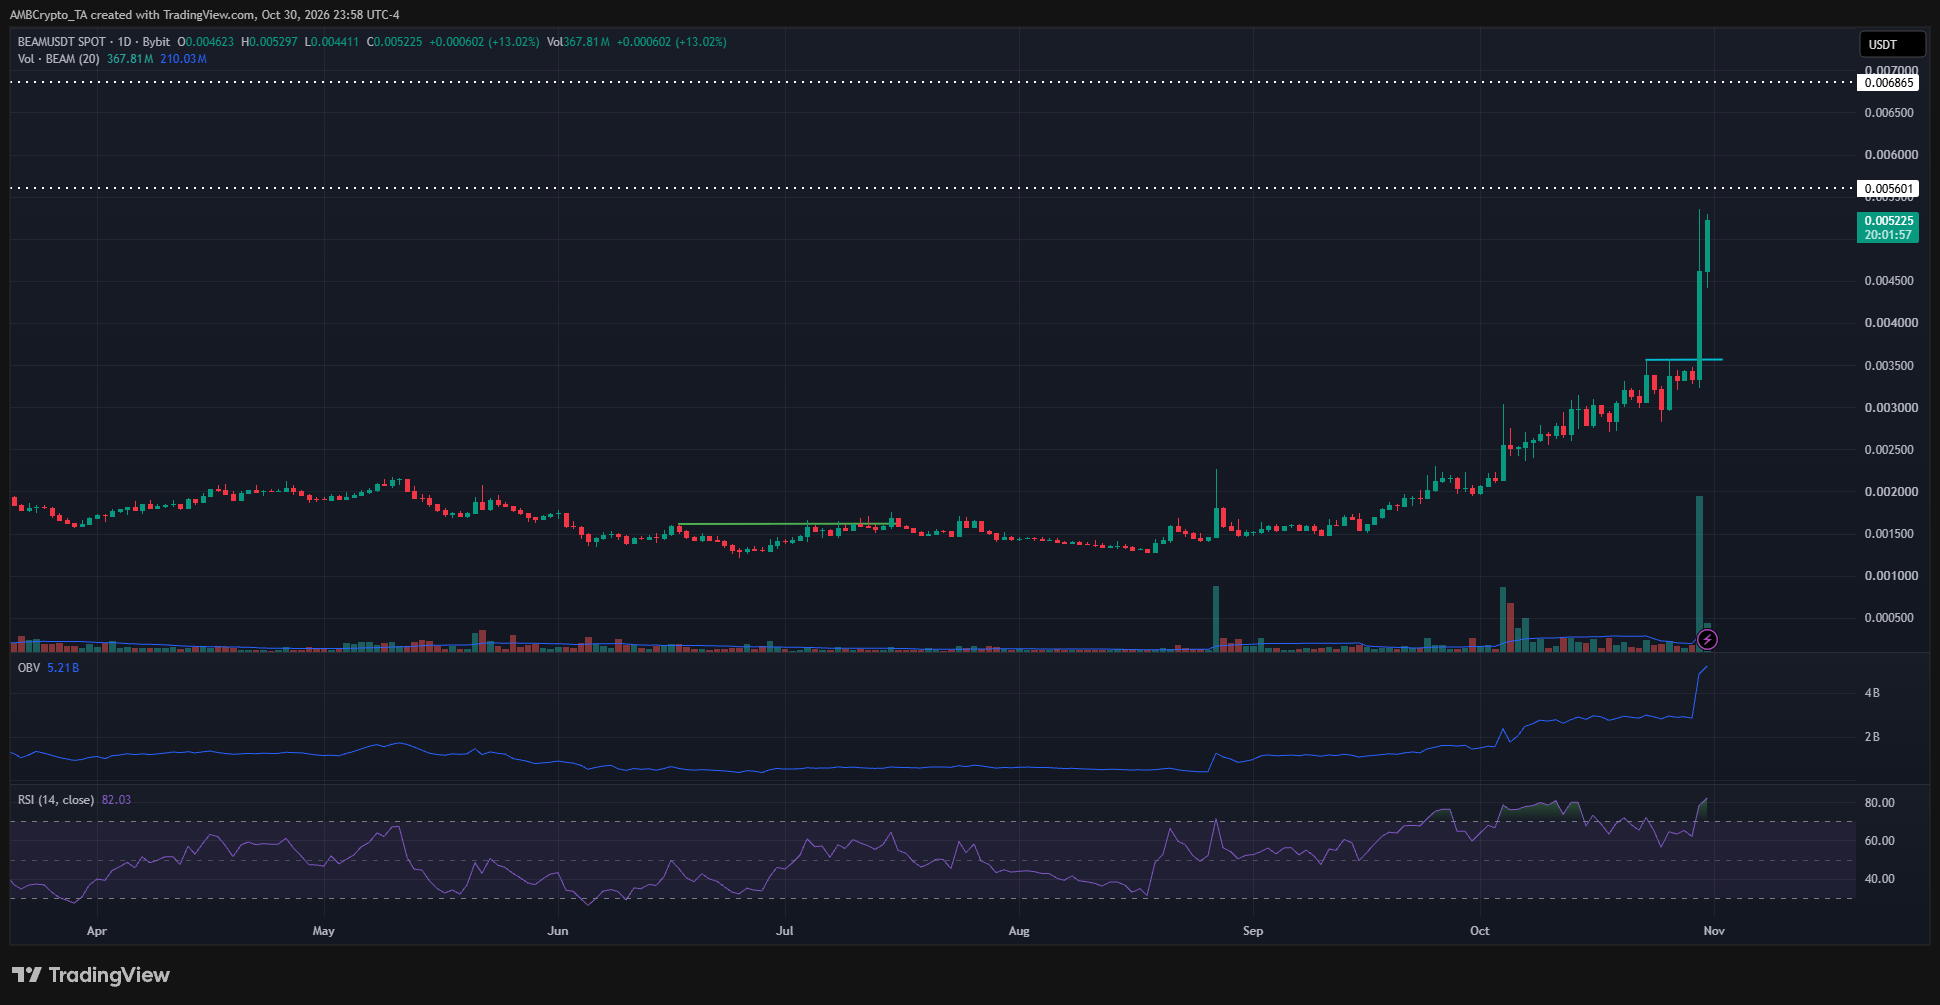
In June, BEAM broke above the downtrend’s lower high at $0.0016, flipping its structure bullishly. The latest bullish continuation came when the $0.00356-high, made on 23rd October, was breached on the 30th.
The breakout was on extraordinary volume and the gains continued at the time of writing. Relative to the rest of the market, the latest bullish impulse move was highly noticeable.
It is likely the altcoin may be overextended. The RSI on the daily chart was at 82, once again in overbought territory. This does not mean a pullback will immediately follow though. A stretch of ovebought RSI readings earlier in October came alongside a 16.54% move higher over ten days.
Traders’ call to action – Take profits and wait for a pullback
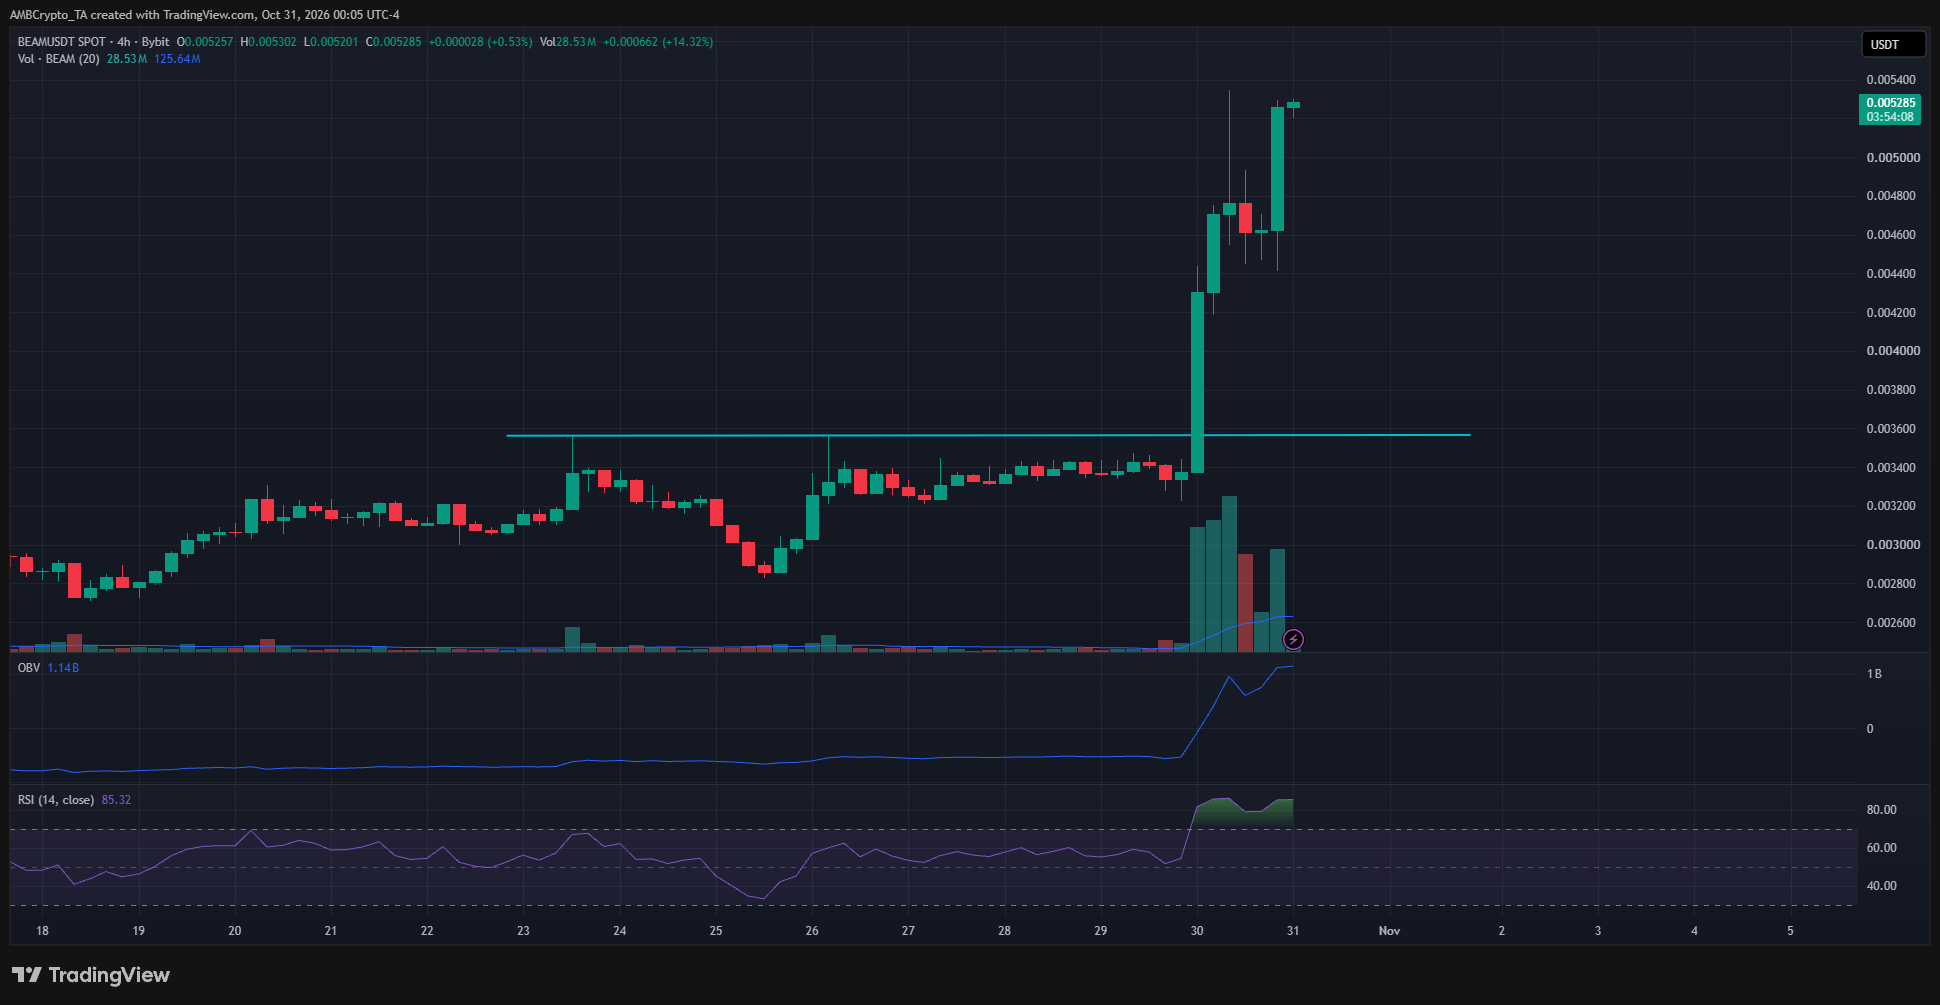
The 4-hour chart showed that there were two support zones of interest right now. The first was at $0.00445, which was respected over the past 24 hours as a demand zone and the altcoin went to challenge the $0.0054 local highs.
The other support zone to watch was the $0.0034 order block that initiated this move higher.
Swing traders can think about taking profits and waiting for a pullback, or moving their trailing stop loss order to just below $0.0034, as per their preferred strategy.
A pullback towards $0.0040 would likely provide a buying opportunity. However, without a clear sign of a short-term pullback, BEAM swing traders need to wait and not rush to look for a re-entry.
Final Summary
- BEAM token has been on an uptrend on the daily timeframe since June.
- Latest impulse move higher has not settled into a pullback yet, and swing traders can choose to wait for a revisit of key demand zones before buying.