Betting against the Bitcoin tide? Consider these on-chain metrics first

After hitting the year’s lowest of $17,774 in mid-June, Bitcoin has gained a steady upward trajectory for the last two months.
It also managed to cross the $24,000 mark recently. This indicated that the selling pressure on the king coin took a back seat.
However, a trend reversal happened on 18 August, which drastically decreased Bitcoin’s price to nearly $21,000, creating a panic situation in the crypto community once again. Nonetheless, several metrics appeared in the bull’s favor.
For instance, Bitcoin’s balance on exchanges reached a four-year low of 2,342,202.837 BTC. Thus, hinting at a bullish market environment.
So you might ask- With this new development, is there a possibility of the next bull rally?
Looking for an answer
After registering a rise in mid-July, BTC’s balance on exchanges gained southbound momentum and reached its four-year low despite the recent price movements.

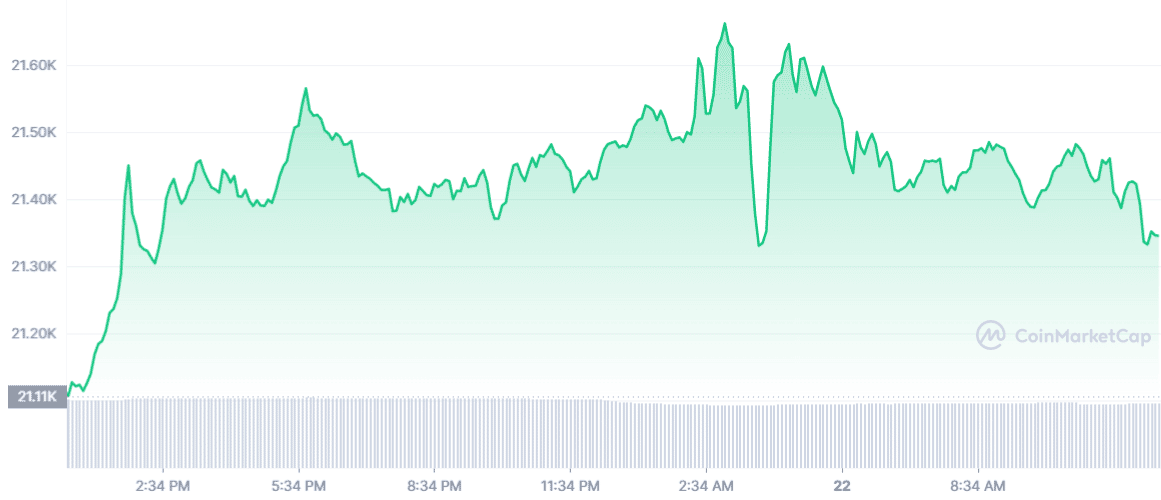
Besides, the 24-hour BTC price chart also supported the bulls as it went green.
At the time of writing, Bitcoin was trading at $21,343.01 with a market capitalization of $408,324,544,759.
A slight recovery was seen as BTC showed a positive 1.15% performance growth over the last day.
Additionally, Bitcoin’s number of addresses with non-zero balances also increased from 42,643,752 to 42,699,265 on 22 August. This suggested that investors’ confidence in BTC hasn’t suffered despite its price volatility.

On the other hand, the MVRV ratio plunged simultaneously with the price and hit the month’s lowest of 0.9617, after which it bounced upward.
Now, at the time of writing, the MVRV ratio was below the one mark.

Going ahead
Looking at BTC’s 4-hour chart pointed out certain cues for long-term traders.
A bullish ascending triangle pattern was formed, indicating a possible uptick soon. Moreover, the MACD also displayed a bullish crossover on 21 August.
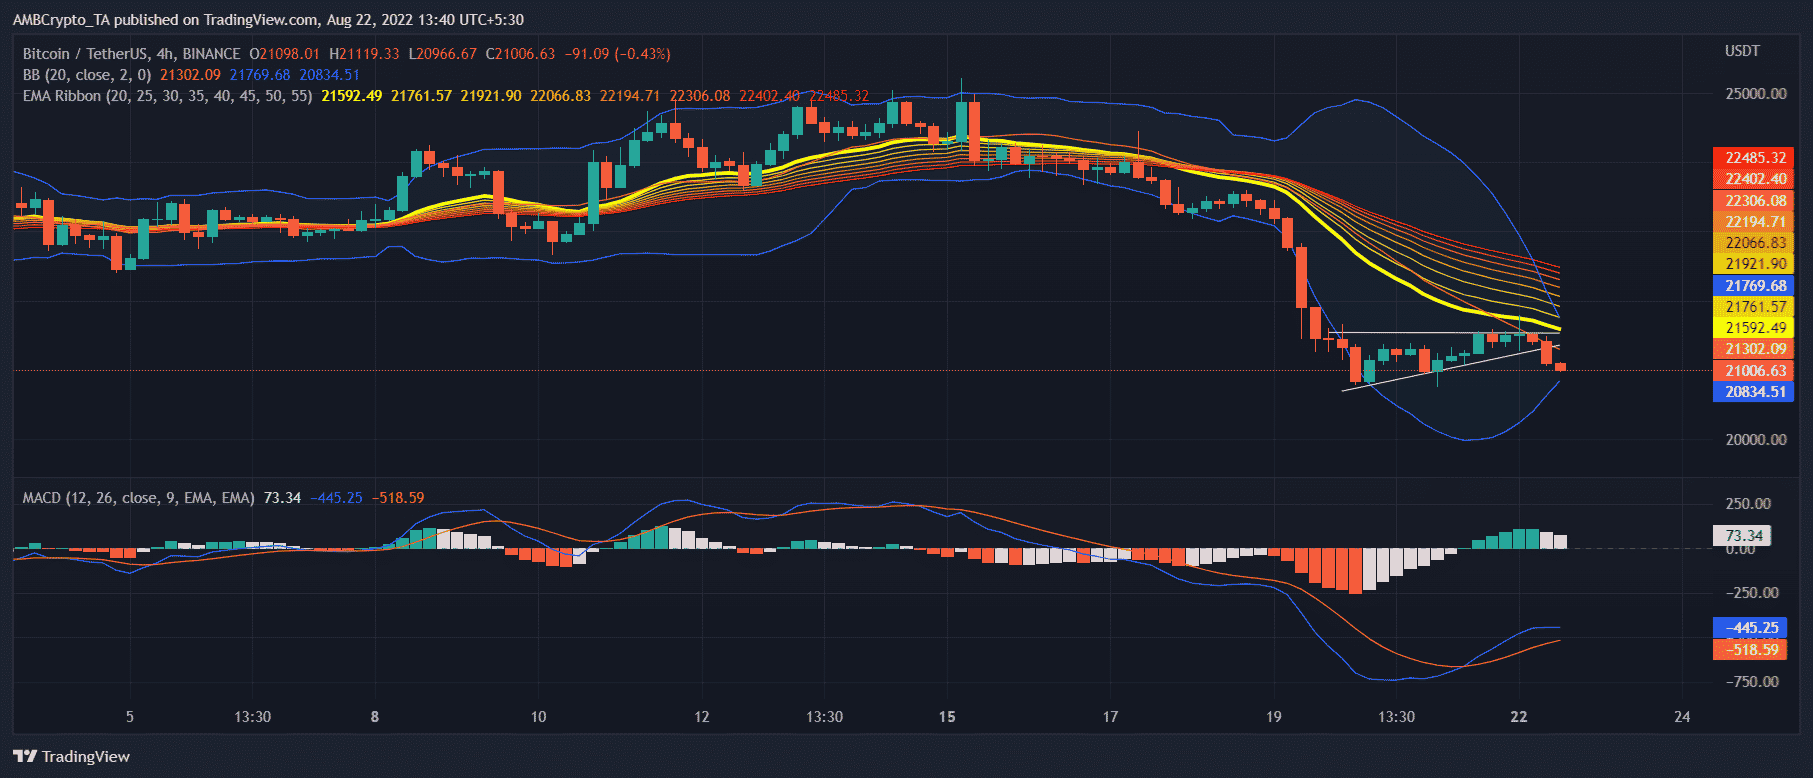
Now, the Bollinger Bands indicated that after being in a high volatility zone for a while, BTC’s price might see a crunch. Thus, minimizing the possibility of a northward breakout.
On top of that, the Exponential Moving Average (EMA) ribbon also complimented Bollinger Bands’ data as the 55-day EMA was well above the 20-day EMA, indicating a bearish advantage in the market.