Binance Coin, BitTorrent, VeChain Price Analysis: 14 May

Binance Coin flashed bearish conditions on the 1-day timeframe, but the lower timeframes were seeing some bullish resurgence at press time. BitTorrent’s channel between $0.0078 and $0.0051 could remain intact considering low volatility. Finally, VeChain cut its losses at the $0.166-support, but awaited stronger signals for a hike past the $0.203-resistance level.
Binance Coin [BNB]

The daily timeframe and 4-hour timeframe showed a contrasting picture for Binance Coin. The 1-day chart highlighted several bearish conditions in the market as BNB lost out to the $600-mark and the 20-SMA (red). The Awesome Oscillator formed a bearish twin peak setup, while the MACD line dropped further below the Signal line and even noted a bearish divergence.
On the flip side, the 4-hour chart noted a bullish resurgence after recording successive green candlesticks. This was either reactionary buying or a reversing trend.
In case of the latter, BNB would likely see a rise above $700. However, volumes were not there to support such an outcome just yet. If volumes fail to pick up even after a break above $600, expect some consolidatory movement.
BitTorrent [BTT]
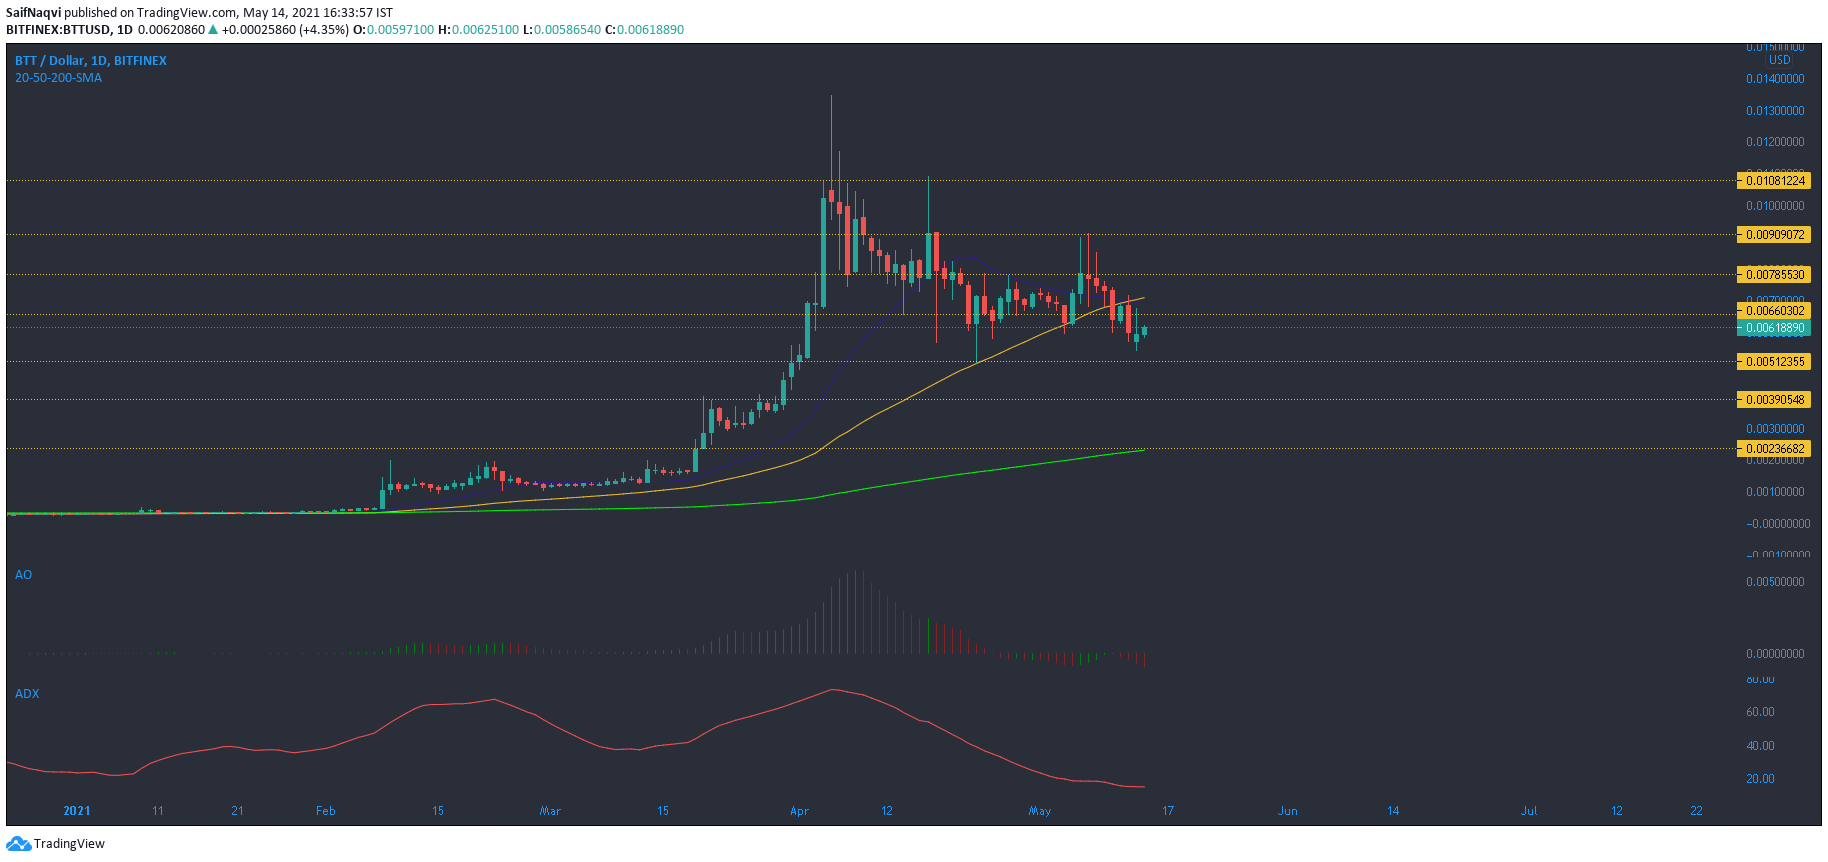
With the ADX clocking in at 17, a weak trend was noted in the BitTorrent market. Coupled with low volatility, sharp movements in either direction were unlikely over the coming days and the channel between $0.0078 and $0.0051 would stay intact. A break below the press time support could see buying at $0.0039 and conversely, a hike above the overhead resistance would be countered at $0.0090.
The Awesome Oscillator has traded below the half-line since the last week of April, but this has not warranted a breakdown just yet. However, that could change if the broader market offers bearish signals. Such an event could see BTT go as low as $0.00236 – An area that coincided with the 200-SMA (green).
VeChain [VET]
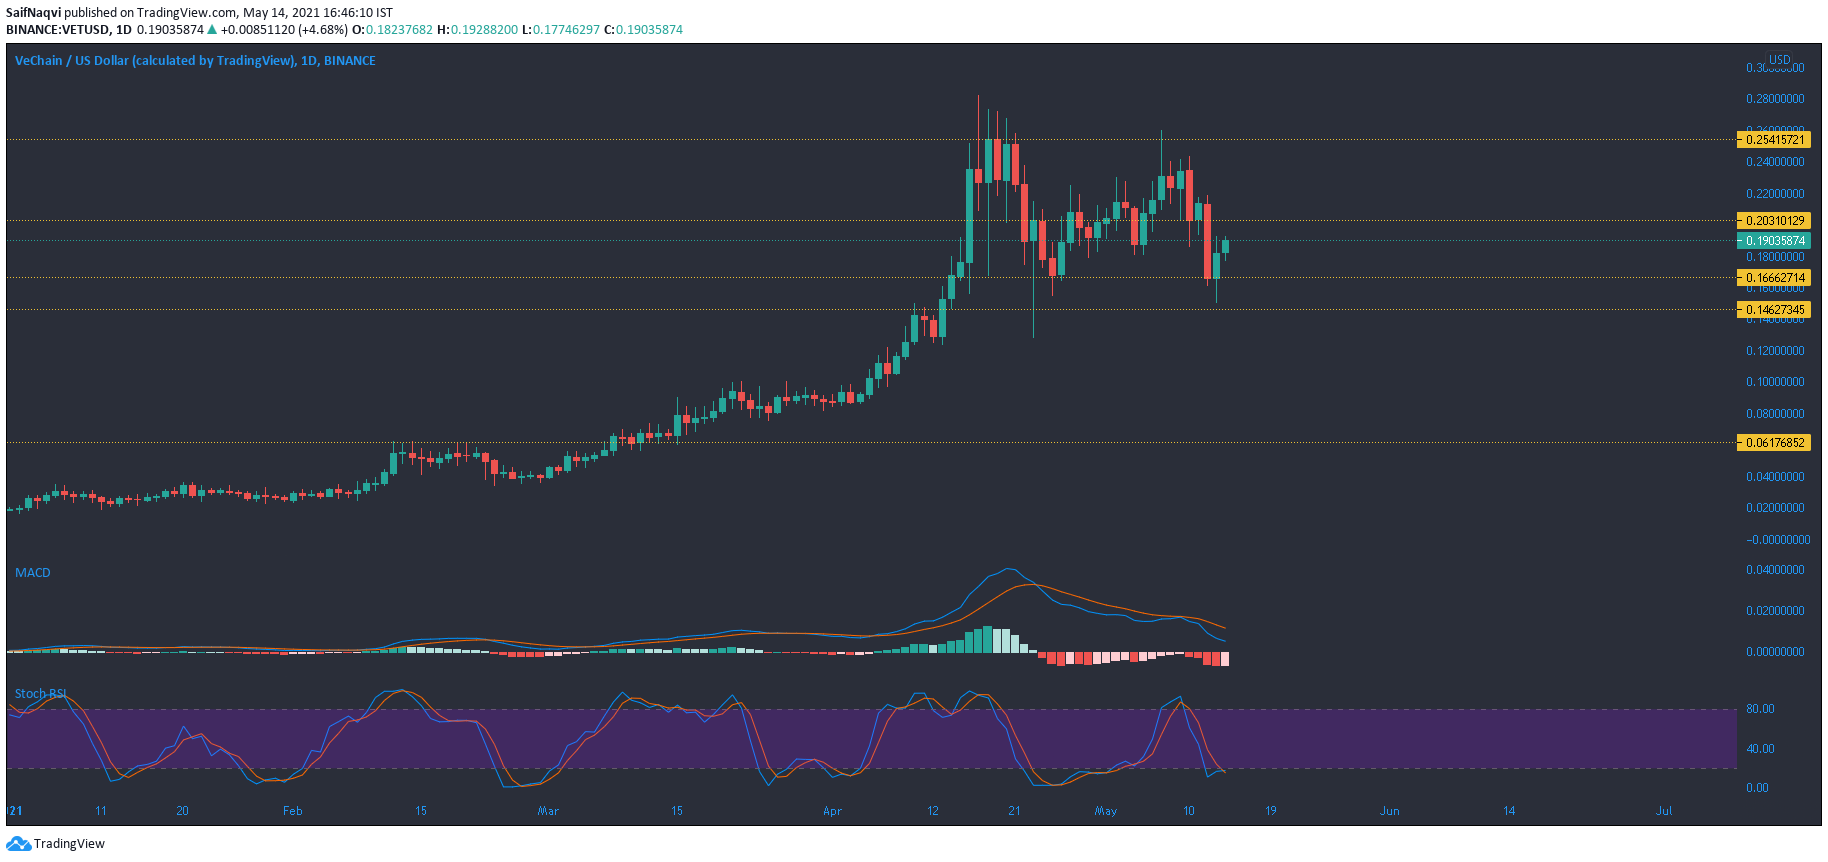
The support at $0.166 was called into action once again after VeChain’s most recent pullback. The aforementioned defensive area has been maintained by the bulls since 15 April and presented a sturdy buy zone. However, VET’s technicals did not side with the bulls just yet and $0.166 would need to be preserved over the coming days, as well as for recovery.
A bearish environment in the market was highlighted by the MACD. The fast-moving line was below the Signal line and was heading towards the half-line. On the flip side, the Stochastic RSI pictured a bullish crossover in the oversold region. A pickup in volumes could see VET regain the area above $0.203-resistance again.