


Disclaimer: The information presented does not constitute financial, investment, trading, or other types of advice and is solely the writer’s opinion.
- Formation of a triangle pattern suggested buyers could be strengthening
- The short-term sentiment was bearish and bulls must be prepared for a drop below $315 as well
Binance Coin hit $350 on 17 April and saw a pullback to fall to $315.3 on 20 April. Since then, there has not been a clear trend on the 4-hour timeframe, although lower timeframes saw heightened volatility.
Read Binance Coin’s [BNB] Price Prediction 2023-24
The price did not form a range but instead showed that a phase of compression was in progress. The fact that this compression was occurring under the $345-resistance meant that bulls could reasonably expect an upward breakout, although buyers did not yet have the upper hand.
Symmetrical triangle pattern shows buyers strengthening under a resistance zone

The Awesome Oscillator has hovering close to the zero line over the past week. It has not been able to stay on either side of the fence, which was due to the price oscillations that Binance Coin registered. The price formed a symmetrical triangle, marked in yellow, which signalled a breakout was imminent.
The direction of this breakout seemed unclear. To the south, the $310-$315 zone of support has been strong since mid-April. To the north, the 4-hour bearish order block marked in red at $345 would be a tough nut to crack as well.
The A/D line has been flat since April 20, and any major dips or surges have been corrected shortly. This is another indication that neither buyers nor sellers have been dominant.
Is your portfolio green? Check the Binance Coin Profit Calculator
A move below $315 would show that the bears had the upper hand. But until that happens, the formation of higher lows beneath a strong zone of supply at $345-$350 means that the buyers are gathering strength. The next bullish targets in the event of a move above $345 are $357 and $388.
Open Interest continues to slump as speculators straddle the fence
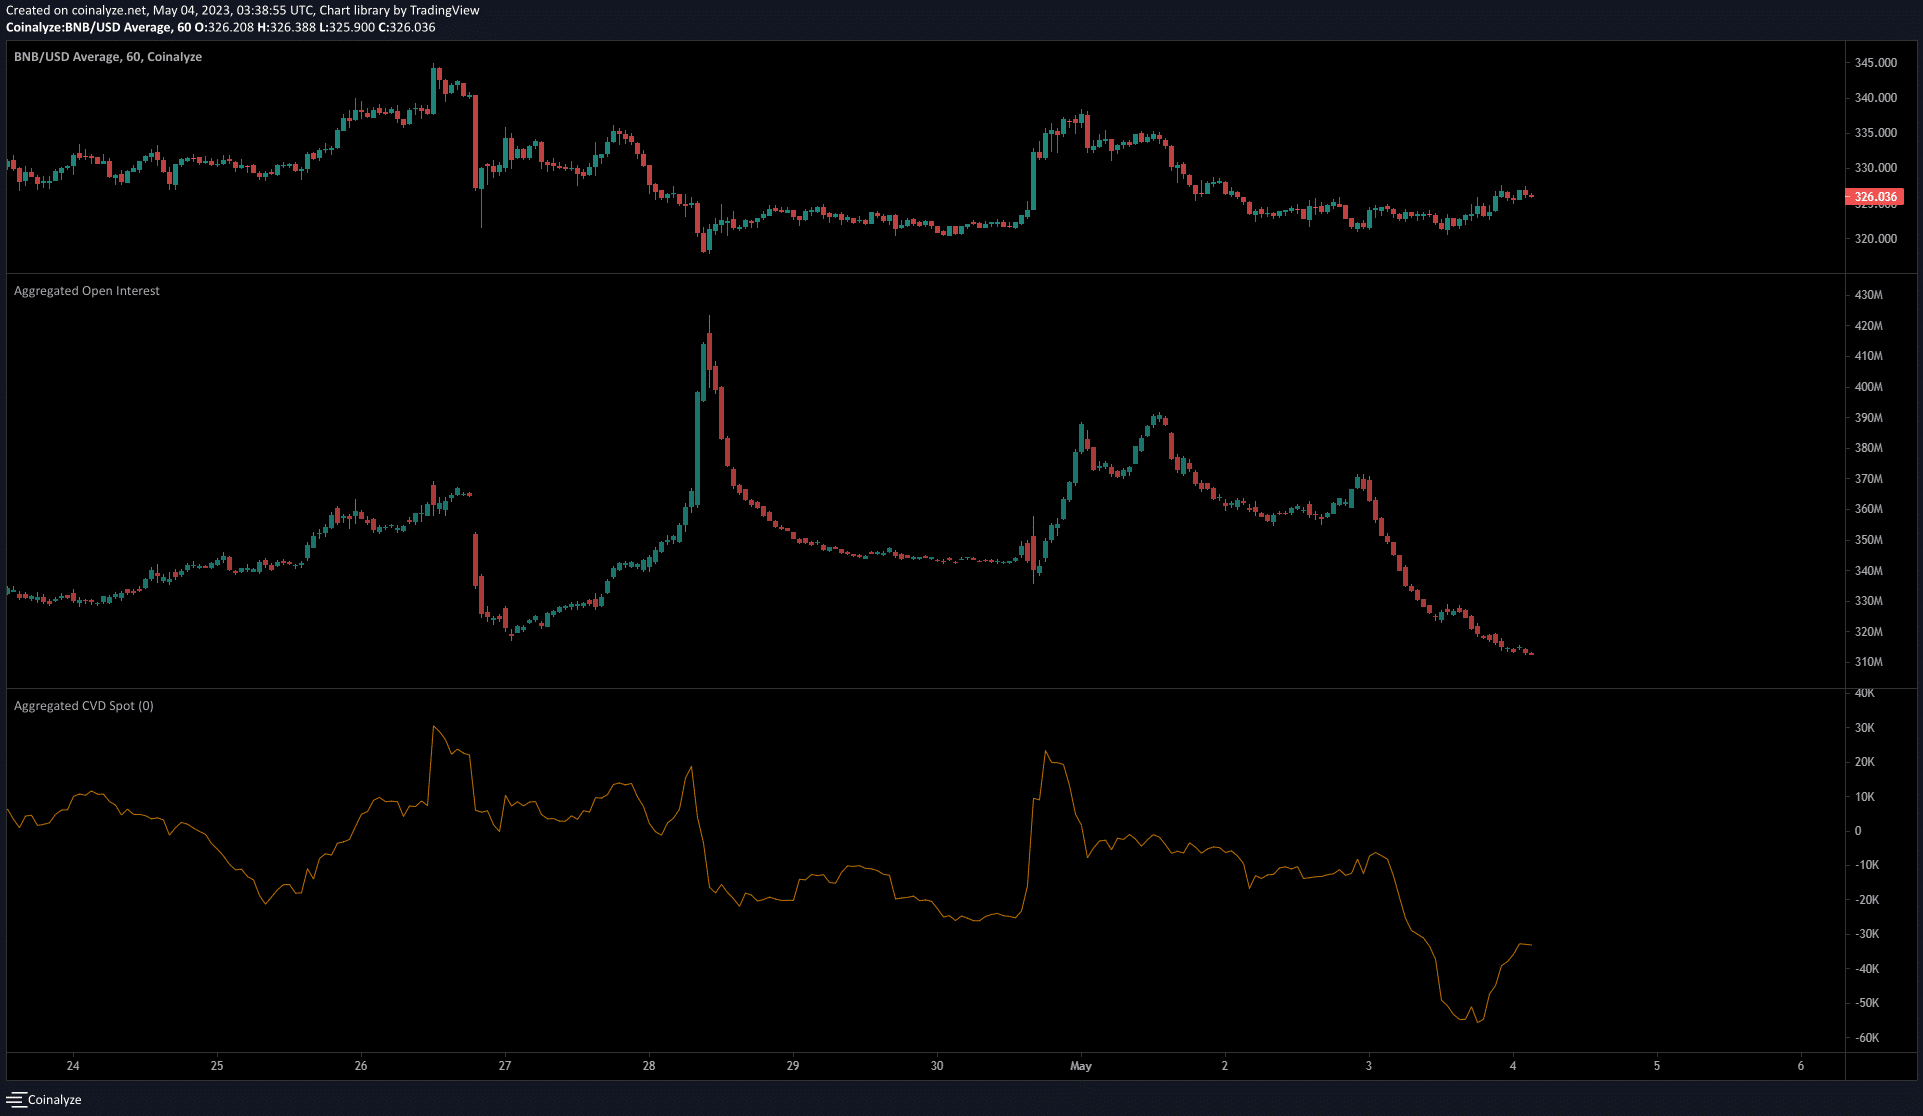
The spot CVD trended south in May after a brief spike on 30 April. This downtrend continued on 3 May as the selling pressure rose. And yet, at this time, BNB fell to touch $321 but recovered a few hours later. At the time of writing, it was trading at $326 but the trading volume was not strong, based on the evidence from the price charts.
Moreover, the Open Interest continued to drop lower and lower over the past 36 hours, even though BNB saw a bounce in price. This showed that bullish speculators were not confident of a short-term rally and highlighted the sentiment was bearish in the market. If this changes in the coming days, it could support a breakout towards $380 for BNB.